Know what worked. See what visitors actually do.

Four analytics views. Four different questions.
Go from experiment performance to what visitors actually do on and after the page.
AB Analytics
Which version performed better?
Compare conversion rate, visitors, engagement and other experiment metrics.
Audiences
Who is actually showing up?
See recognized traffic and which visitor groups CROLabs can identify.
Experiment Paths
Where do visitors go next?
Follow journeys through your site and see where people continue, convert or leave.
Heatmaps
What gets attention?
See where visitors click and how far they scroll on the actual page.
Compare every version side by side.
See whether a change actually improved the outcome you were testing for. Compare conversion rate, conversions, unique visitors and engagement across your original page and every variant.
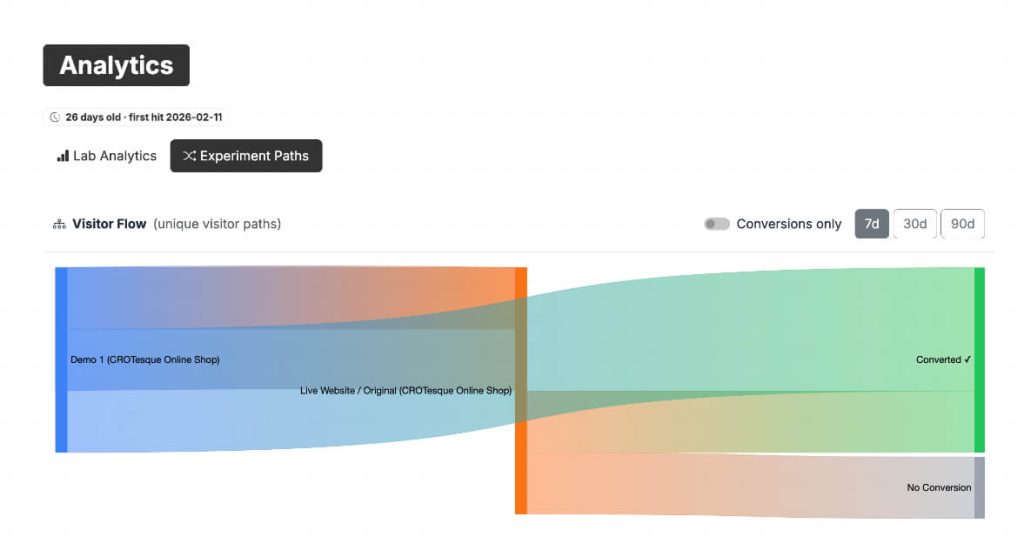
See where visitors go after the landing page.
A conversion problem isn’t always on the page you are testing.
Experiment Paths show how visitors move through your site, where they
continue and where they drop off.
See which routes lead toward conversion and where potentially valuable
traffic disappears before getting there.
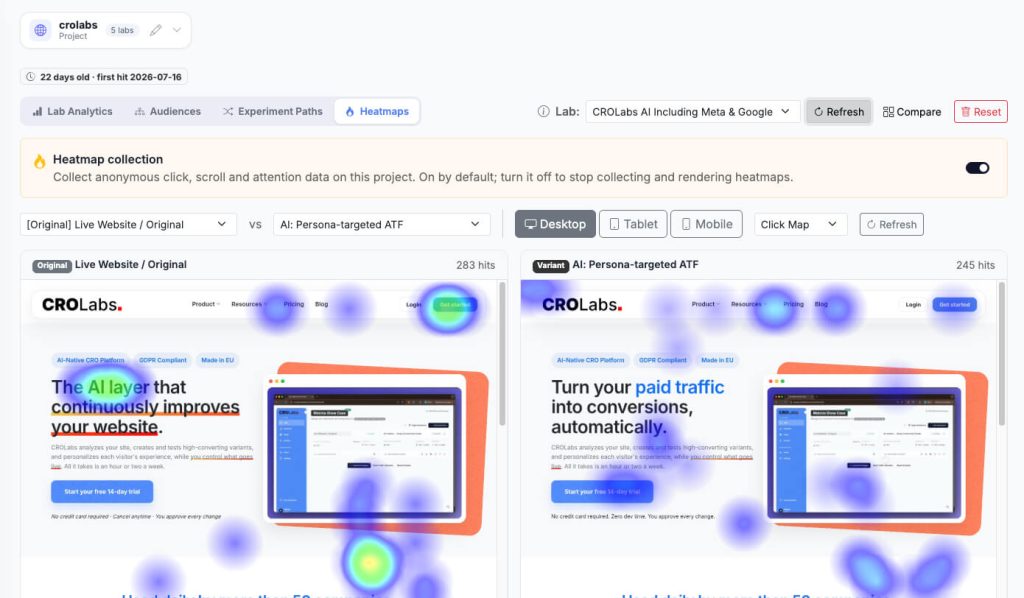
Find out what gets attention and what gets ignored.
Click and scroll heatmaps show how visitors actually interact with the page.
See whether people reach important sections, where they click and which
elements attract attention without leading anywhere.
Use those patterns to find something worth testing next.
Use CROLabs Insights or keep reporting in GA4.
Experiment data lives directly in CROLabs, so you can make decisions without building another analytics setup. If your team already reports in Google Analytics, CROLabs can also send experiment identifiers into GA4 for your existing reports.
CROLabs Insights

Google Analytics 4
Stop guessing what happened.
See which experiments worked, where visitors went and what they did on the page.
Cancel anytime.