Reading time approx. 10 min | Updated on 17 November 2026 | First published on 16 November 2026
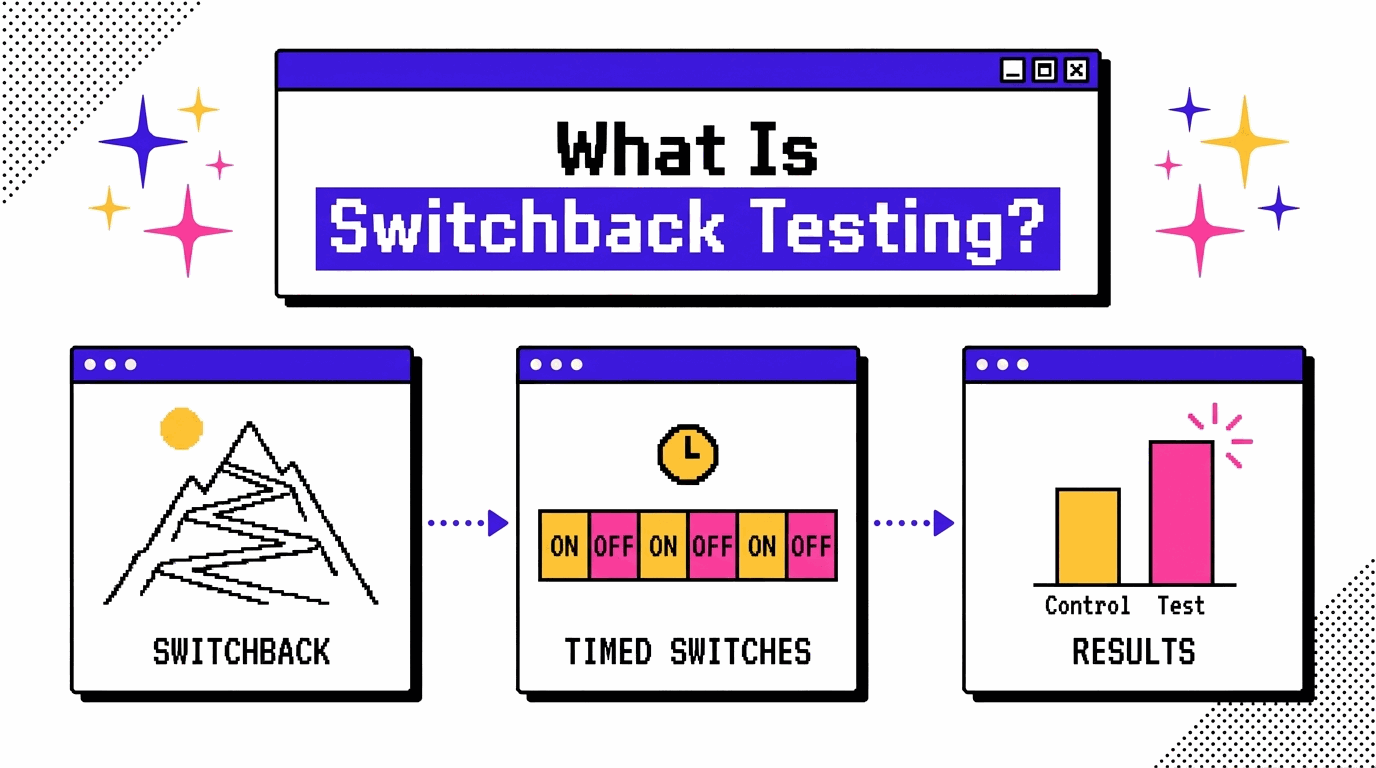
Switchback testing gets its name from a switchback, which is a stretch of road that turns sharply back on itself so a vehicle can climb a steep slope.
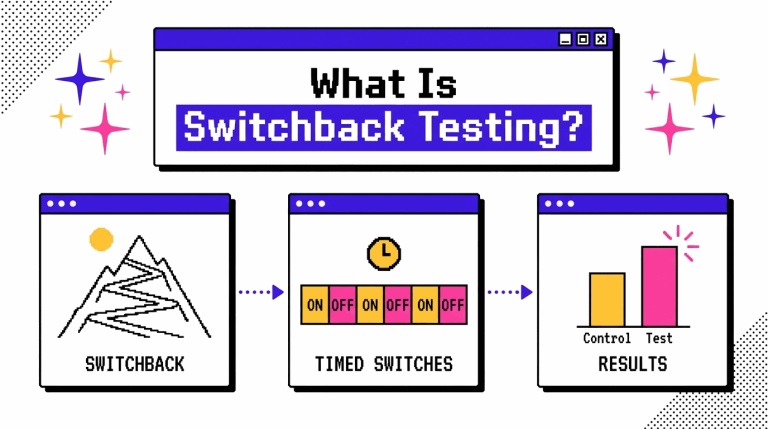
It’s an experiment that turns a change on, turns it off, and turns it on again across set blocks of time. Each block takes a turn as the control or the treatment, and the results from both kinds of blocks get compared at the end.
Plenty of experiments split people into groups, and that setup works until the groups start affecting each other. Switchback testing was built for that situation.
In this guide, we’ll cover what the method is, what it does well, where it falls short, two real examples from DoorDash and Lyft, and how to tell whether your own test needs it.
In short
- Switchback testing (also called a time-split test) alternates control and treatment over randomized blocks of time, with all traffic in a block seeing the same version.
- It fits tests where users share limited resources or influence one another, which breaks a regular A/B test.
- The trade-offs are carryover effects, fewer independent data points, and a longer road to statistical confidence.
- For page-level changes on a website, a user-level A/B test in CROLabs is usually the simpler route.
What Is Switchback Testing?
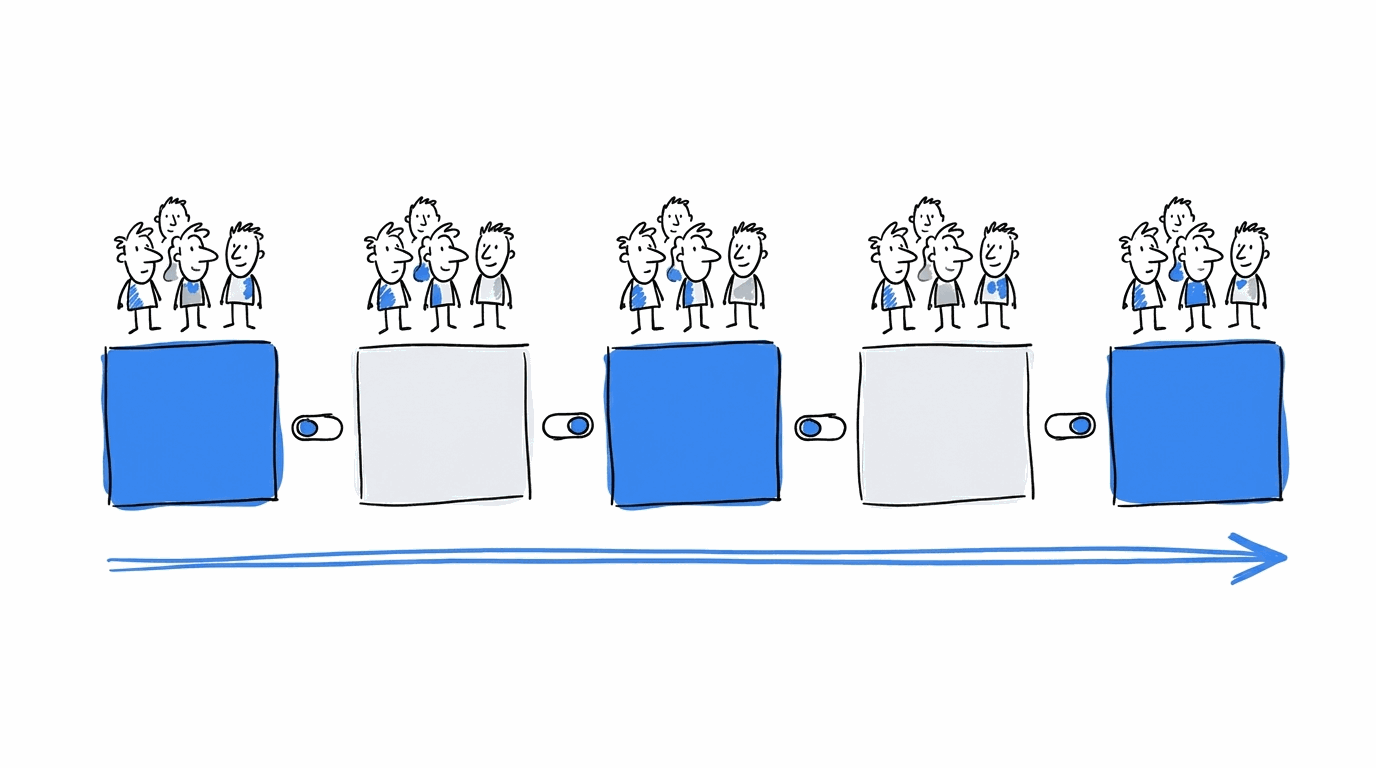
Switchback testing is an experimental method that measures how a change performs across different periods of time. The same population is exposed to both the control and the treatment, with each assigned to alternating time blocks according to a random schedule. Once the experiment is complete, the results from the treatment periods are compared with those from the control periods.
DoorDash uses this approach to run experiments across its delivery marketplace. In its explanation of the method, the company describes assigning experiment buckets randomly across geographic areas and time periods, rather than assigning individual users to different groups. For example, an experiment might run between 6 pm and 10 pm on a Tuesday in a particular city. During that window, the entire area receives either the control or the treatment, depending on the schedule.
This is quite different from a standard A/B test, where visitors are divided into separate groups and each group sees a different version at the same time. That’s how A/B testing works in CROLabs, too. Incoming traffic is randomly distributed between a control and a variant, allowing you to compare how each version performs.
This approach works well when one visitor’s experience has no bearing on what another visitor sees or does. However, some environments are more interconnected. For example, a change to delivery fees or driver incentives could affect the behaviour of customers and drivers across an entire marketplace. Running a user-level experiment in that situation can introduce interference between the two groups, making it difficult to tell whether the results came from the change itself or from the way people in the marketplace interact. Statisticians refer to this as interference, while marketplace teams often describe the same phenomenon as network effects.
Here’s how the two designs compare.
| A/B test | Switchback test | |
|---|---|---|
| What gets randomized | Users or sessions | Blocks of time (and often regions) |
| Who sees which version at once | Both versions, to different people | One version, to everyone in the block |
| Handles interference between users | No | Yes, mostly |
| Number of independent data points | Many users | Fewer blocks |
| Main risk | Contaminated groups | Effects that linger into the next block |
Running A/B tests on your website?
If you’re testing headlines, page layouts, CTAs or forms, you can split your traffic between a control and a variant with CROLabs. Set up experiments, track conversions and see how each version performs.
How a Switchback Test Runs
- Pick the single change you want to test and the metric that will judge it.
- Cut the calendar into blocks, and split by region too if you operate in several.
- Assign every block to control or treatment at random.
- Run the schedule, flipping the change on or off at each block boundary.
- Compare the metric across both sets of blocks, using statistics built for blocks as the unit of analysis. DoorDash uses cluster robust standard errors for this, since deliveries inside one block aren’t independent of each other. Our guide on avoiding false positives in A/B tests covers why that kind of correction matters.
How Long Should Each Block Run?
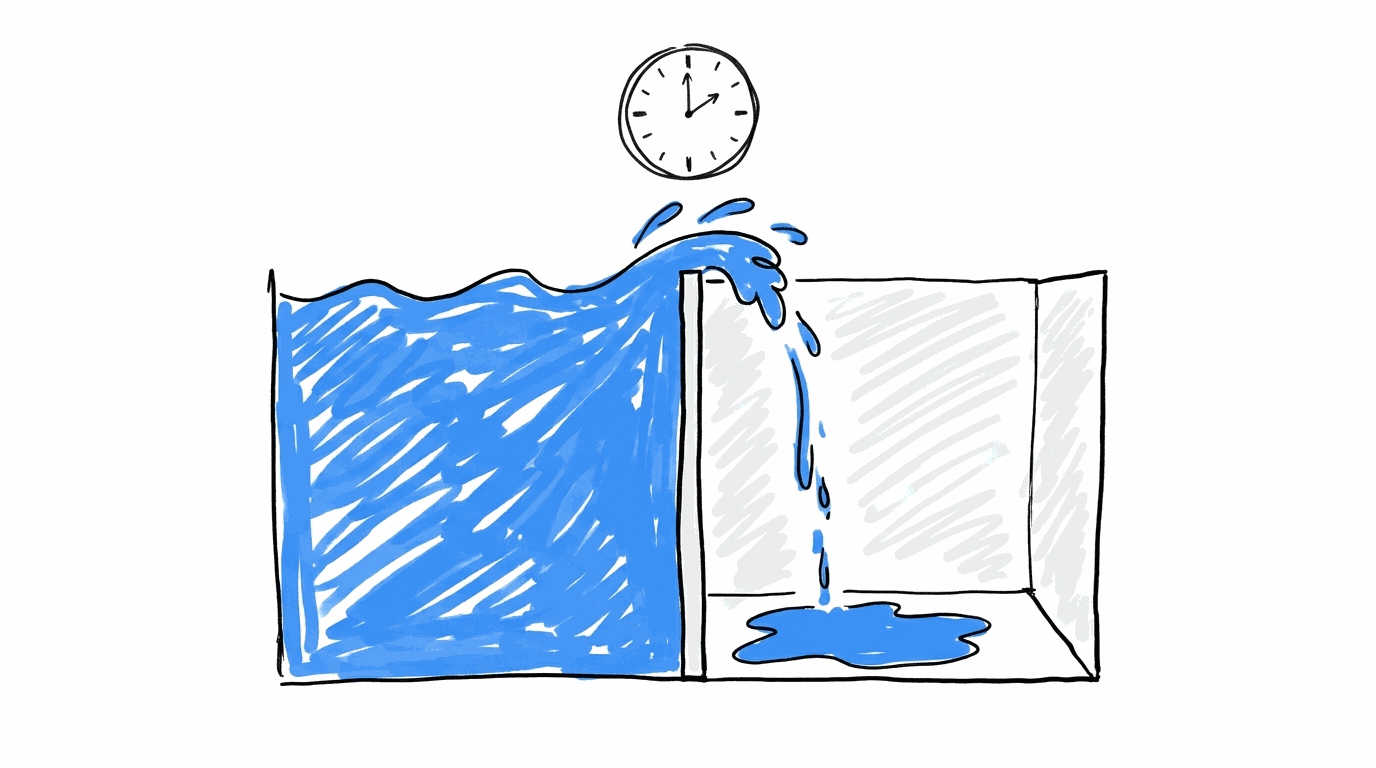
Longer than the time your change takes to settle. When Lyft tested a reinforcement learning approach to rider-driver matching, most marketplace metrics took two to three hours to stabilize after the switch from control to treatment. That pushed the team toward buckets longer than four hours, which was unusually long for them.
If a block ends before the effect has settled, the leftover effect leaks into the next block and muddies the comparison. Researchers call this leakage a carryover effect, and a walkthrough on Towards Data Science shows how to size blocks around it. Measure how long your change takes to settle first, and set the block length after that.
Benefits of Switchback Testing
a. It handles interference
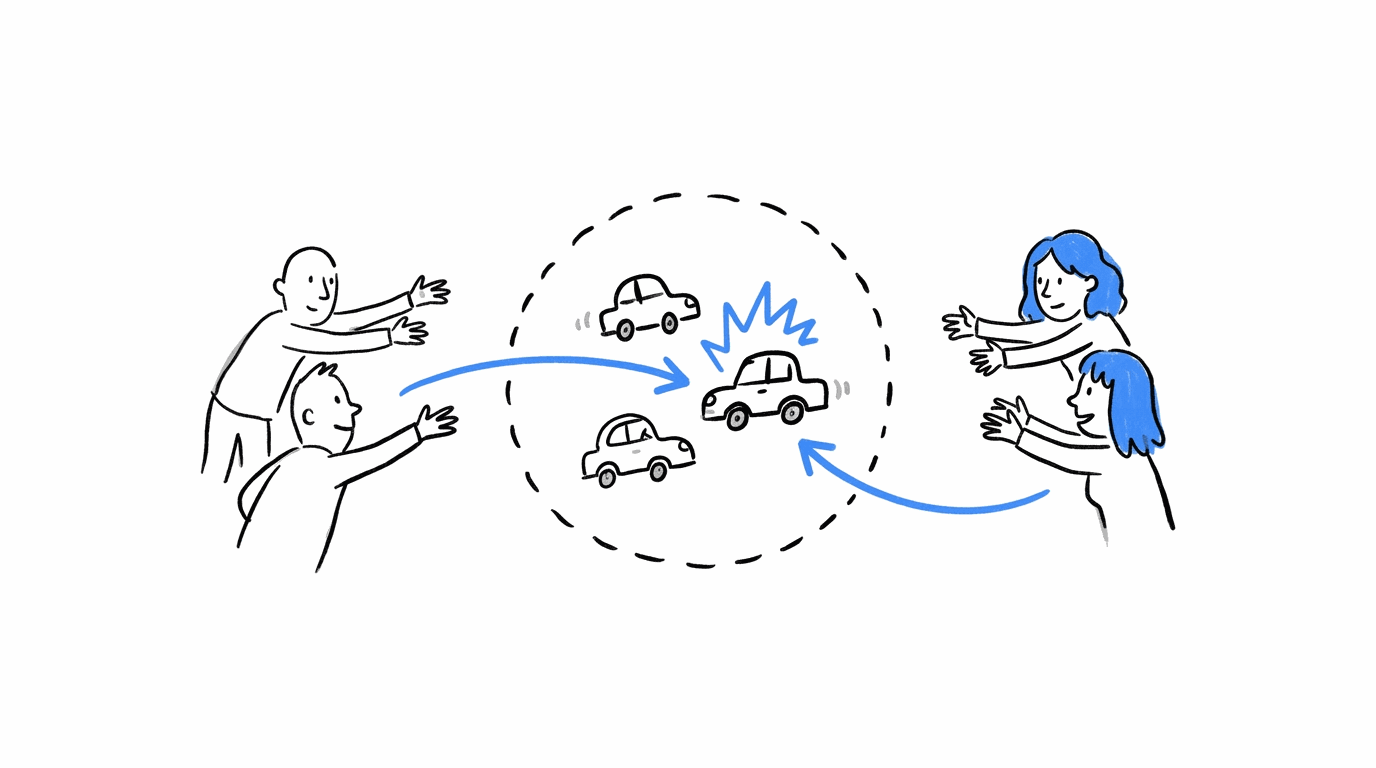
Everyone in a block sees the same version, so one user’s variant can’t change what another user gets. Lyft’s researchers call time-split tests the most widely used technique for interference in ridesharing platforms.
b. It tests whole-system changes
Pricing rules, matching algorithms and dispatch logic touch everyone at once, and a time-based switch lets you flip the entire system.
c. It works where user-level randomization is unavailable
Some platforms give you no way to hold out individual users. DoorDash used a switchback design for exactly this reason, and we’ll walk through it below.
d. Both versions face the same surroundings
Control and treatment run in the same place over the same stretch of weeks, so a local event or a seasonal swing hits both sets of blocks.
e. The setup resembles an A/B test
Switchbacks are implemented much like A/B tests so a team that already experiments will recognize most of the workflow.
Cons of Switchback Testing
a. Carryover effects
A treatment can keep working after you switch it off. Lyft’s engineering team also points out that people who use the app at different times can see different experiences, which complicates the picture for repeat users.
b. Few independent data points
You have a limited number of blocks to analyze, where an A/B test has thousands of users. DoorDash flags this along with the nested structure of the data as the two features that make analysis harder.
c. Longer tests
Fewer data points and block lengths sized for carryover add up to more calendar time before a result is trustworthy.
d. Calendar effects can skew the result
In DoorDash’s ad test, simple random assignment of days ignored the day-of-week effect and left the groups unbalanced. Their fix is described in the second example below.
e. Borders still leak
DoorDash notes that switchbacks aren’t free from network effects around the geographic and temporal borders between blocks.
f. Disruptions hurt more
A system outage or a competitor’s bidding change during a short schedule lands on a small number of blocks and can swing the whole result.
Switchback Testing Examples
Example 1: Lyft’s Rider-Driver Matching Algorithm
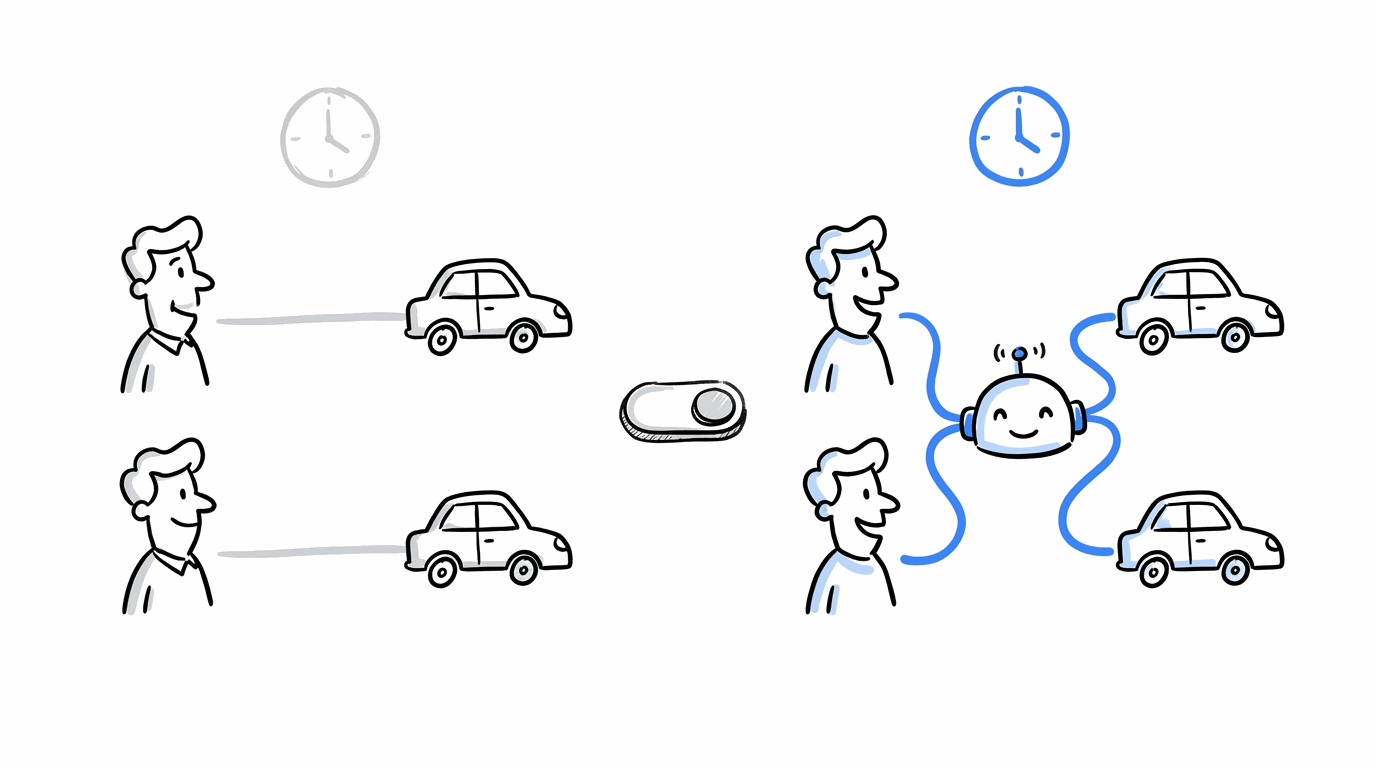
Lyft wanted to know whether a reinforcement learning approach to matching riders with drivers beat its existing algorithm. A user-level split wouldn’t work here, because a driver matched to one rider is unavailable to the next one, so the two groups would compete for the same drivers.
The team ran time-split experiments in 2021. During treatment hours, the matching algorithm included the new approach, and during control hours it didn’t. The switch applied to riders and drivers in the marketplace together, which kept both sides in a single version at any moment.
The lesson for your own tests is the block length. Metrics needed two to three hours to settle after each switch, so the team lengthened its buckets to give each version a clean measurement window.
Example 2: DoorDash Measuring App Marketplace Search Ads
DoorDash faced a different obstacle. The team wanted to know how many new app downloads its search ads on an app marketplace produced, and the publisher only measured lift between ad creatives. Geo-targeting wasn’t precise, and users could block the identifier needed for user-level randomization.
So the team adapted a switchback design. It randomized each day in week one as campaign on or off, reversed that sequence in week two, and kept alternating until the campaign ended. Weekends then landed in both groups. The team measured app downloads for each group, took the difference, and multiplied it by the download-to-first-order conversion rate to estimate incremental new customers.
The post also lists conditions for the method to work: the conversion has to happen soon after the ad click, the historical baseline has to hold steady during the test, and the randomization has to be sound. It names the limits as well, including outages and shifts in competitor bidding.
When You Use Switchback Testing
Switchback testing should be used in a few specific situations:
- Users draw from a shared, limited pool, such as drivers, delivery slots, inventory or support staff.
- The change affects a marketplace algorithm for pricing, matching or dispatch.
- The platform gives you no way to randomize individual users, as in DoorDash’s ad test.
- An operational change applies to a whole location at once, such as a new routing rule or staffing schedule.
A Two-Question Check Before You Choose
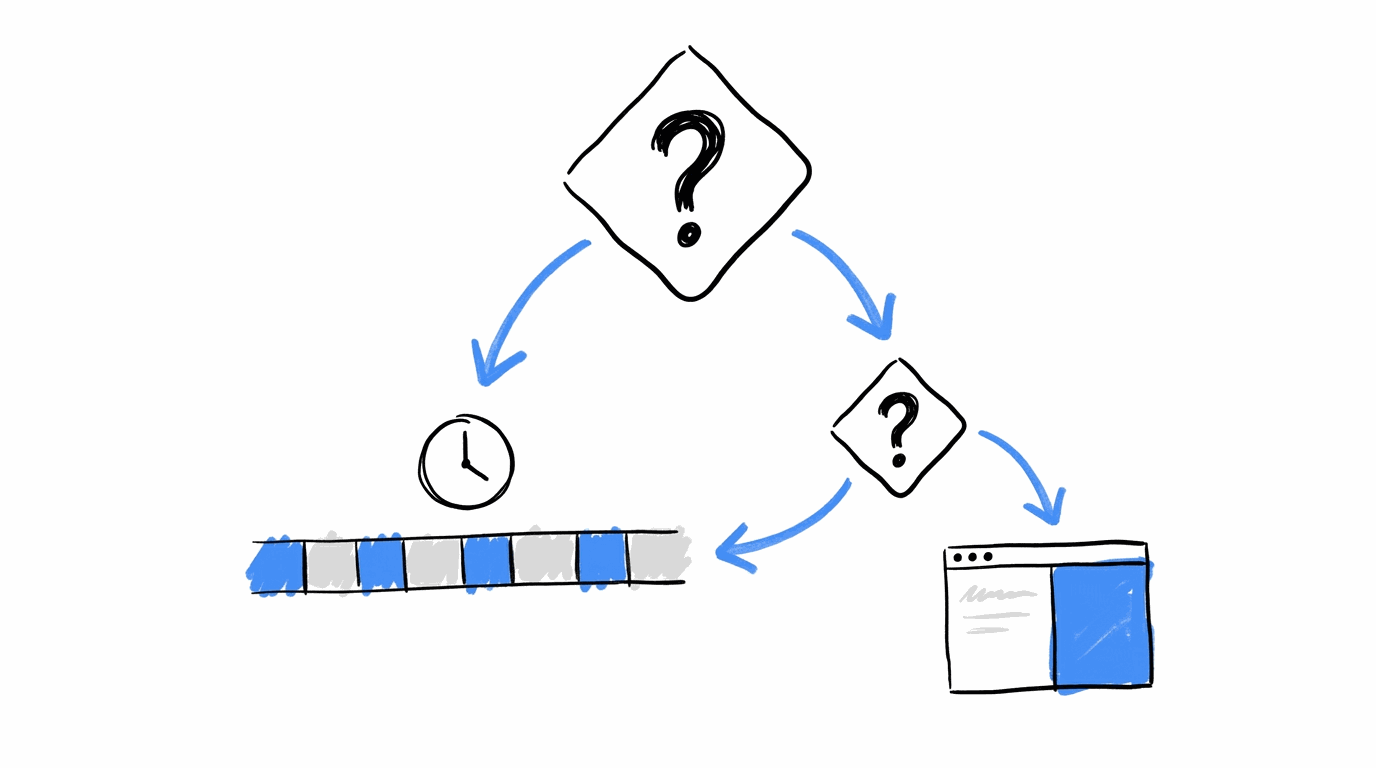
- Does one user’s version change what another user gets? Say a store has 40 units of a product left, and a discount shown to half the visitors drains the stock before the other half arrives. The groups now affect each other, and a switchback design deserves a look.
- Can you split users at all? If the answer is no, a time-based split might be the only valid option.
If both answers are no, an A/B test is the better pick. Headlines, CTA buttons, form fields and page layouts don’t change what the next visitor sees, so a user-level split works and gives you far more data points. CROLabs handles that split, and its multivariate testing covers cases where several elements change together. You can track the outcomes with conversion tracking and read the behavior behind them in analytics and heatmaps. If you don’t know what to test yet, the CRO Advisor points to the pages with the biggest conversion leaks.
Conclusion
Switchback testing swaps users for time as the thing you randomize. That swap protects a test from interference, and it brings carryover effects, fewer data points and longer schedules along with it. Lyft and DoorDash both reached for it because their usual A/B setup had no way to give a clean answer.
Most website experiments don’t face that problem, and for those, conversion rate optimization runs on A/B and multivariate tests that split visitors. If that describes your tests, you can try CROLabs free for 14 days with all features, and a steady experimentation roadmap will carry you from there.
Ready to run your next website experiment?
CROLabs makes it easier to test page changes, compare variations and track their effect on conversions. You can also use heatmaps and analytics to understand how visitors interact with your pages before deciding what to test.
FAQs

Keep learning on the CROLabs blog
Practical guides on A/B testing, personalization and landing page optimization. New articles every week.
Ready for measurable optimization?
Show us one landing page. In 30 minutes we walk you through what CROLabs would test first and what it could mean for your conversion rate.