Updated Nov 2026
Airbnb’s A/B tests succeed 8% of the time, according to Ronny Kohavi, who worked on experimentation at Airbnb and Microsoft. At a success rate that low, a result with a p-value under 0.05 has a 26% chance of being a false positive, even though the dashboard labels it a 95% confident winner.
A figure like that changes how much weight a single winning test deserves, so we’ll look at where false positives come from and which settings bring them down. We’ll also look at the CROLabs feature that handles it.
On This Page
In short
- A false positive happens when an A/B test reports a winning variation even though the change has no real effect on conversions.
- The risk can exceed the 5% suggested by a 95% confidence level, especially when only a small share of your experiments produce genuine improvements.
- Four practices help reduce that risk: work out the required sample size before launching, let the test reach that number, choose one primary conversion goal, and investigate unusual results for possible setup errors.
- CROLabs supports these practices with A/A testing, guardrails that pause experiments once they reach your chosen sample size, and a setting for selecting your primary conversion goal.
What Is a False Positive in an A/B Test?
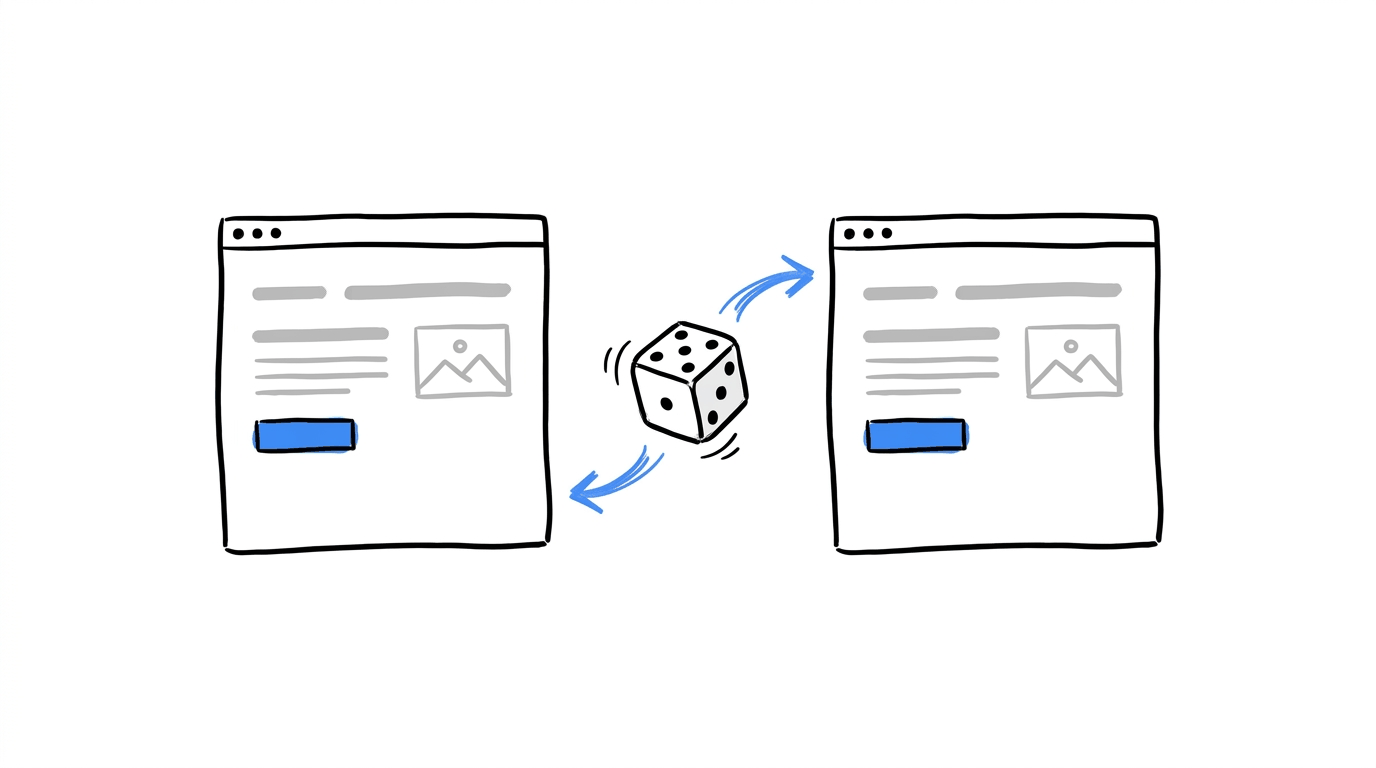
A false positive, known in statistics as a Type I error, occurs when an A/B test reports a difference in conversions between the original page and the new version, even though the change had no effect.
The likelihood of this happening is controlled by the significance level, or alpha. A common setting is 0.05, which means you’re willing to accept a 5% risk of declaring a variation the winner when it produces no real change. There’s also the possibility of a false negative, where a variation improves conversions but the test doesn’t pick up the improvement. When you lower alpha, you make false positives less likely, although you also increase the chance of missing a genuine improvement. That’s why choosing a significance level involves considering both types of error.
Here’s what a false positive costs once it ships:
- A change goes live that adds nothing to conversions, and the original rate carries on under a report that says otherwise.
- The next experiment gets designed around a win that cannot be repeated.
- A number in a client report drops back once the following month’s data comes in.
- The record of what works on your site collects entries that nobody can reproduce.
If you’re new to the mechanics behind all of this, our guide on what A/B testing is covers the basics of control and variant.
Why a 95% Confidence Result Can Still Be Wrong

A p-value below 0.05 means that, if the variation had no effect on conversions, a difference as large as the one observed would occur less than 5% of the time. However, this calculation doesn’t account for how likely the original idea was to produce an improvement. That matters because the success rate of your experiments affects how many of the results labelled significant turn out to be false positives.
Ronny Kohavi refers to this as the false positive risk. According to the figures discussed in Convert’s glossary, when only 10% to 20% of experiments produce a successful result, the actual risk of a false positive can be four to five times the reported p-value. The table below shows figures from three companies that Kohavi has shared, as presented in this breakdown of his data.
| Company | Share of tests that succeed | False positive risk at p < 0.05 |
|---|---|---|
| Airbnb | 8% | 26% |
| Booking.com | 10% | 22% |
| Microsoft | 33% | 5.9% |
The figures in each row start with the company’s historical experiment success rate, which represents the likelihood that a test will produce a real improvement. When that rate is low, a larger share of statistically significant results can come from random variation. This helps explain why Airbnb’s false positive risk is considerably higher than Microsoft’s. Kohavi’s paper on A/B testing intuition goes into the full calculation, and the breakdown above links to it.
Your own testing program has a historical success rate as well, and there are ways to improve it.
Four approaches work here:
- Use a stricter alpha for expensive decisions: Convert’s glossary suggests thresholds such as 0.01 or 0.005 when a wrong call costs a lot.
- Re-run borderline results: A test that lands near the threshold can be repeated, and the two runs combined.
- Start from evidence: Analytics & Heatmaps show where visitors drop off, and the CRO Advisor gives you a prioritized list of what to fix, so the ideas you test come from observed behavior and carry a better chance of working.
- Check interest before you build: A fake door test measures demand for an idea at low cost, which filters out ideas before they take up a full experiment.
Get better ideas for your next A/B test
CROLabs Analytics & Heatmaps show where visitors struggle on your website, while CRO Advisor helps you identify areas worth testing. Use those insights to build experiments around real visitor behaviour.
How Many Visitors Does Your Test Need? A Worked Example
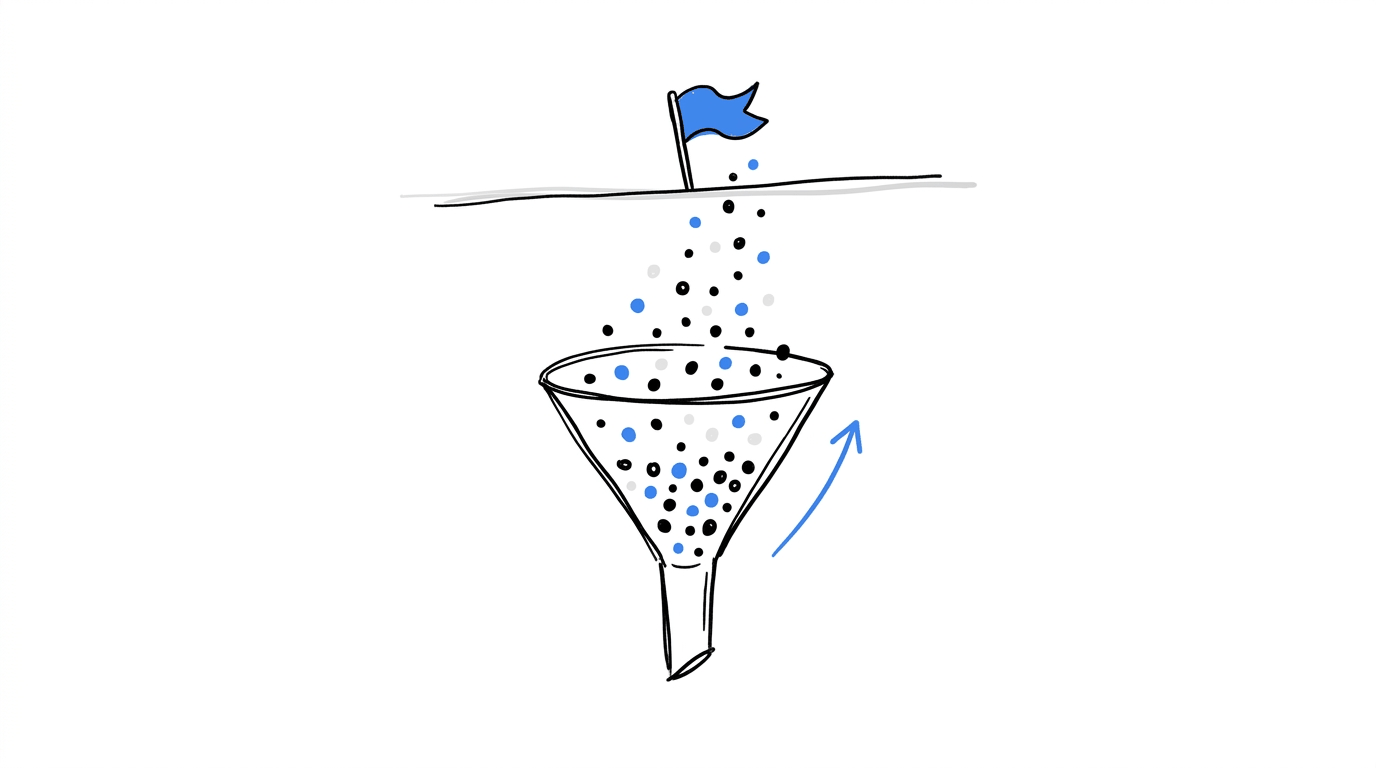
Four inputs go into a sample size calculation, as Statsig’s walkthrough lays out: baseline conversion rate, minimum detectable effect (MDE), statistical power, and significance level.
Let’s say a pricing page converts 4% of visitors and you want to detect a 10% relative lift, which takes the rate to 4.4%. At 95% significance and 80% power, the standard two-proportion formula gives roughly 39,500 visitors per variant. The table shows how that requirement moves with the lift you’re trying to detect.
| Relative lift | Target rate | Visitors needed per variant |
|---|---|---|
| 5% | 4.2% | about 154,000 |
| 10% | 4.4% | about 39,500 |
| 20% | 4.8% | about 10,300 |
Calculated with a two-sided two-proportion test at 95% significance and 80% power, starting from a 4% baseline.
Now put that against traffic. With 3,000 visitors a day split evenly, each variant collects 1,500 a day, so the 10% lift test needs about 26 days. Rounding up to 28 days gives four full weeks, which covers each weekday four times. Small lifts need far more traffic than large ones, so a page with modest visitor numbers is better matched to bold changes than to small tweaks.
Allegro’s engineering team describes what happens when this calculation gets skipped: the test is stopped the first time significance appears, as they explain in their post on calculating the required sample size.
In CROLabs, we recommend at least 300 unique visitors per variant before drawing conclusions. That figure is a floor, and the number your test needs comes from the calculation above. Once you have it, the scheduling guardrails can pause the experiment automatically when it reaches your target sample size.
Why Checking Results Early Inflates False Positives
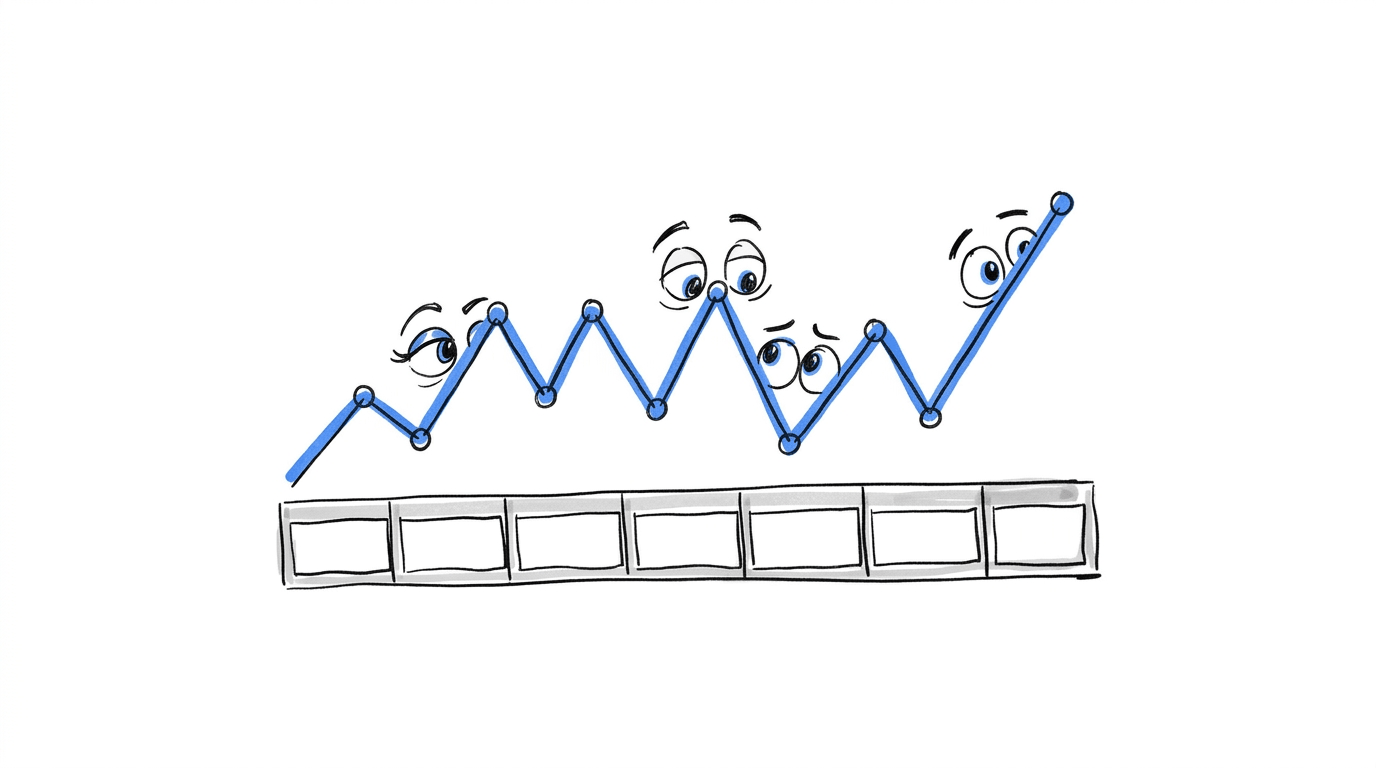
Every look at a running test is another significance test. MetricGate’s analysis guide puts it this way: each time you check and consider stopping, you run another implicit test. Ten checks give random noise ten chances to reach a p-value below 0.05, and one of those readings is enough for someone to call the test.
If you need to monitor results continuously, sequential methods exist for that purpose. CXL’s simulation of thousands of tests compares ordinary peeking with sequential testing and shows how the two behave.
For a standard fixed-sample test, these steps keep the error rate where you set it:
- Write down the sample size and the end date before launch.
- Choose a duration in full weeks so that each day of the week is represented equally.
- Use the dashboard during the test to confirm tracking works and visitor counts look right, which is the check Woobox recommends in place of reading early significance.
- Let CROLabs scheduling pause the test at the target sample size, so the stop decision gets made before you have seen any numbers.
Track One Primary Goal Per Test
Each extra metric you track gives the test another chance to show a false positive. If the metrics were independent, the chance that at least one of them crosses 0.05 by luck is 1 − 0.95 raised to the number of metrics.
| Metrics tracked | Chance of at least one false positive |
|---|---|
| 1 | 5% |
| 5 | 22.6% |
| 10 | 40.1% |
| 20 | 64.2% |
A checkout test that watches clicks, scroll depth, cart additions, purchases, and coupon use is in the five-metric row, so about one test in four or five would show a spurious winner somewhere.
Two fixes cover this. The first is to name one primary metric before launch and let that metric alone decide the result. The second is a correction for multiple comparisons: with the Bonferroni method, described in MetricGate’s list of common testing mistakes, you divide alpha by the number of metrics, so five metrics get tested at 0.01 each.
CROLabs is built around the first fix. You set a primary conversion, such as a signup, purchase, form submission, or button click, and the other behaviors you track show up as observations that don’t decide the winner. Conversion Tracking is where you define it. Multivariate testing adds another consideration, since each combination of elements is its own comparison and needs enough visitors to be read; the feature is best suited to high-traffic pages for that reason.
Keep your A/B test results focused
Choose the conversion that matters most to your experiment with CROLabs Conversion Tracking. You can monitor other visitor actions alongside it, while keeping one primary goal responsible for determining the winner.
Twyman’s Law: What To Do When a Result Looks Too Good
Twyman’s Law says that an unusually large result deserves suspicion. Kohavi applies it to experiments: when a result looks too good or too bad to be true, investigate for flaws before celebrating, as he describes in this summary of his talk on A/B testing.
These are the checks to run on a surprising result.
Sample ratio mismatch
If you configured a 50/50 split, the visitor counts in each arm should land close to 50/50. Say a test reports 5,200 visitors in the original and 4,700 in the variant. With 9,900 total, the expected count per arm is 4,950, and a chi-square test on that gap gives a p-value far below 0.001. A gap like that falls outside what random assignment produces, so something in the setup is dropping or duplicating visitors, and the conversion results cannot be trusted. Kameleoon’s guide lists sample ratio mismatch among the guardrails to build in.
You can compare visitor counts per variant in CROLabs Analytics. An A/A test is the other tool here: it runs the same experience against itself to validate tracking and setup before a real change goes live. At a 95% threshold, about 1 in 20 A/A tests will show a difference by chance, so a single flagged A/A result calls for a repeat before you conclude anything is broken.
Calendar effects
A test that starts on the first day of a Black Friday sale measures how the variant performs during sale traffic. The same variant could behave differently the week after. Running through full weeks and avoiding the start of a promotion keeps the sample close to ordinary traffic.
Returning visitors
A visitor who sees the original on Monday and the variant on Thursday contaminates both arms. CROLabs has sticky assignment, which keeps returning visitors on the same version for the whole experiment.
Replication
For a borderline or surprising win, repeat the test. Kohavi’s advice on Convert’s glossary is to replicate tests with borderline p-values and combine the results with meta-analysis techniques.
Pre-Launch Checklist

This table puts the steps from this article in the order you’d run them, with the matching CROLabs feature.
| Step | What to do | Where it lives in CROLabs |
|---|---|---|
| 1 | Write the hypothesis and pick one primary goal | Conversion Tracking |
| 2 | Calculate sample size and duration | Run the numbers first, then compare with the 300-visitor floor on the A/B Testing page |
| 3 | Validate tracking on a new page or setup | A/A Testing |
| 4 | Set the traffic split and leave it alone | Traffic allocation (the A/B Testing FAQ notes that big mid-test changes can affect results) |
| 5 | Set the stop rule | Scheduling guardrails |
| 6 | Keep returning visitors consistent | Sticky assignment |
| 7 | Compare visitor counts per variant | Analytics |
| 8 | Re-run borderline wins | Duplicate the experiment and run it again |
A fixed traffic split keeps the arithmetic in this article valid. CROLabs also offers Smart Traffic, which adjusts allocation as performance data comes in, so choose the fixed option when you want to follow the sample size math above.
For the bigger picture on how tests fit together over time, our CRO roadmap and the ultimate guide to conversion rate optimization cover planning, and the best CRO tools comparison covers the software side.
Conclusion
False positives come from a short list of setup choices: the sample you collect, when you stop, how many metrics you watch, and whether you investigate results that look too good. Each one can be settled before launch, and the numbers in this article give you something concrete to settle them with.
CROLabs gives you the settings for that in one place: a primary conversion, A/A testing, sticky assignment, and scheduling guardrails that pause a test at your target sample size. You can try them on your own site with the 14-day free trial, and no credit card is required.
Run your next experiment with more control
CROLabs gives you the tools to manage your experiments, from A/A testing and sticky assignment to conversion tracking and scheduling guardrails. Set your sample size, configure your test, and let the platform pause it when it reaches your target.
Start with the 14-day free trial. No credit card required.
FAQs