Updated Oct 2026
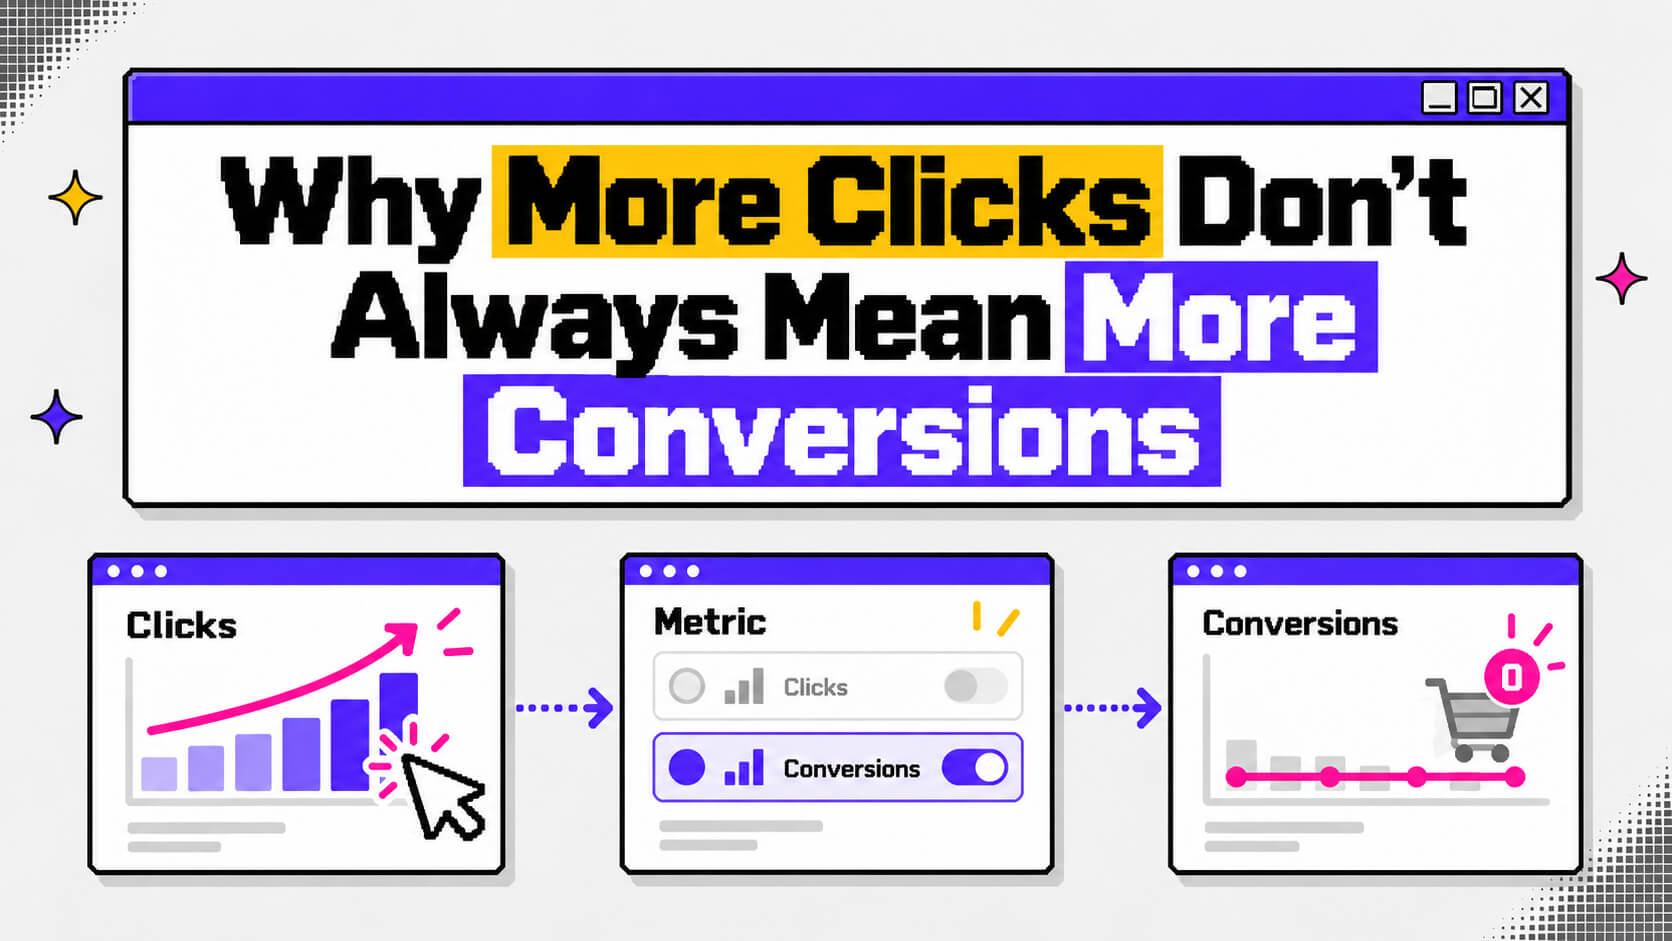
A higher click-through rate can make a campaign look healthier at first glance. Since more people are clicking, the percentage goes up and the dashboard looks better.
Sometimes, however, things start to look strange when you check what happened after the click.
A Shopify store owner ran into this with a TikTok campaign. During the first phase, the campaign had a 0.50% click-through rate. People were adding products to their carts and starting checkout, but none of those sessions ended in a completed payment.
The owner then changed the conversion being tracked to full payment. The reported click-through rate jumped to 6.20%. On paper, that sounds like a major improvement, yet the store recorded zero add-to-carts and zero orders.
The numbers had changed dramatically because the measurement had changed. The campaign had not suddenly become six times more effective at turning visitors into customers.
On This Page
What a Click Records and What a Conversion Records
A click tells you that someone took the first step. It means they pressed an ad, clicked a button, or interacted with something that sent them further into the journey. Once that person lands on your site, other things start affecting what happens next.
On the other hand, a conversion happens when they complete the action your business has decided matters, such as placing an order or booking a call.
Those actions happen at different stages, so their rates tell you different things.
| Metric | Formula | What it tells you |
|---|---|---|
| Click-through rate | Clicks ÷ impressions | How often people who see an ad or button choose to click it |
| Conversion rate | Conversions ÷ visitors | How often visitors complete the action you’re tracking |
| Qualified conversion rate | Qualified conversions ÷ conversions | How many of those conversions come from people who fit your target |
Conversion rate is still just a ratio. If you divide orders by visits, changing either number changes the rate.
Adobe’s analytics team points this out in its discussion of falling conversion rates. If traffic increases while orders stay at the same level, the conversion rate will fall. A new email campaign or banner can bring in that extra traffic without producing more orders. Adobe also recommends breaking conversion rates down by channel and looking at how many visitors viewed more than one page to get a better sense of traffic quality.

For the rest of this article, conversion refers to the specific action your business has chosen as the outcome. Clicks, scrolls, form starts, and add-to-carts can all happen along the way, but they are steps in the journey rather than the final conversion.
Clicks tell you who showed interest.
With CROLabs, you can track the actions that matter to your business and use them as the primary conversion goal in your experiments.
Four Situations Where Clicks Climb and Conversions Stay Level
The four situations below pair an activity number that rises with a result number that stays level or falls. A table after the fourth collects the cause and the first place to check for each one.
1. A call to action that promises more than the page delivers
A CTA can get plenty of attention simply because of how it is worded. What happens after the click depends on whether the destination page follows through on that message.
Go Fish Digital identifies message mismatch and misleading creative as common reasons an ad can attract a high number of clicks without producing the same level of conversions.
Consider an ad that promotes free shipping for the weekend. Someone clicks because that offer sounds useful, then lands on a product page where shipping is barely mentioned. They now have to search for the information that convinced them to click in the first place.
The same thing can happen when an ad focuses on a particular use case but sends visitors to a generic page with a broad headline and a lifestyle image. The ad gave them a specific reason to click. The landing page gives them something else to figure out.
Go Fish Digital also points to a pattern where an ad gets strong engagement while the resulting traffic produces weak product views and few add-to-carts. In that situation, some of the clicks may come from people who were interested enough to investigate but had little intention of buying.
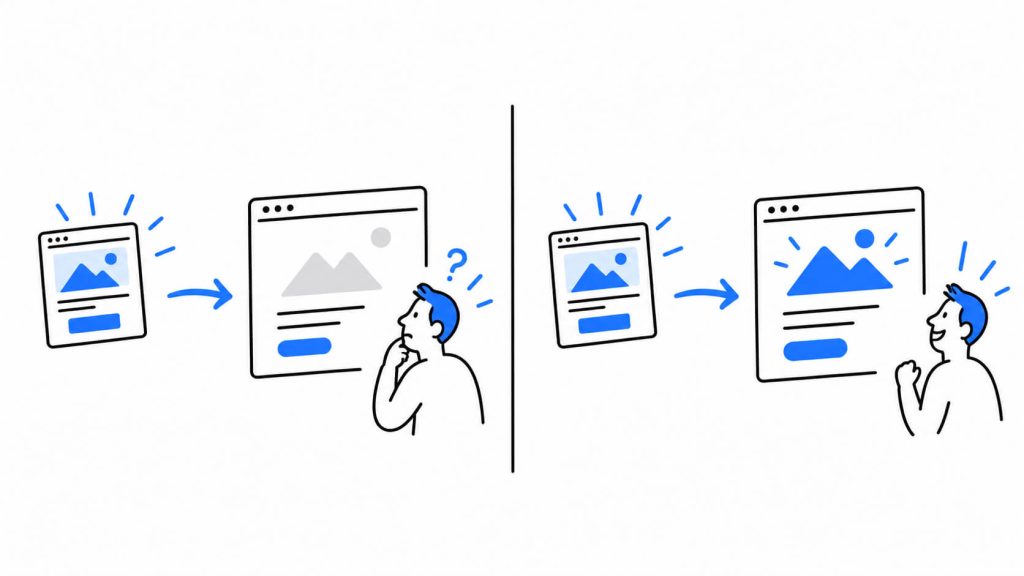
There is a simple way to check for this on your own site. Write down exactly what the CTA or ad promises. Then open the destination page and look at the first section a visitor sees. If the promise has disappeared, you have a possible explanation for why clicks are rising without the downstream action following them.
2. Form starts that climb while completions fall
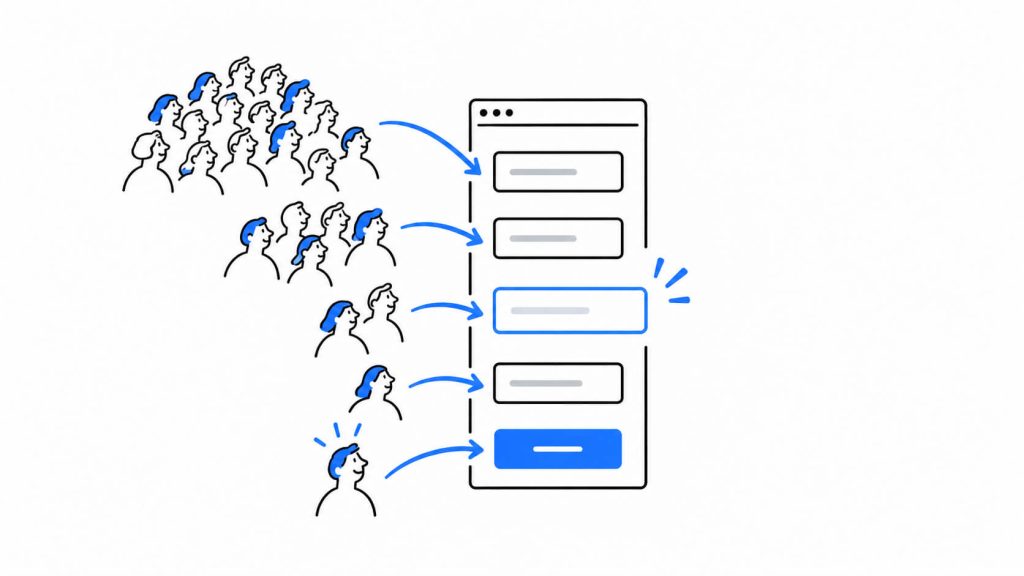
A form start records the first keystroke, and a lead needs a submission. Zuko’s benchmarking data, quoted in Crazy Egg’s roundup of form statistics, shows how much the denominator matters: 66% of people who start a form finish it, and 45% of the people who visit one do. A change that pulls more visitors into starting a form also changes who those starters are, so the finish rate among starters can fall while the start count climbs.
Tracking adds a second cause. Zephra’s guide to B2B lead forms points out that a multi-step form firing its conversion tag on step one reports partial forms as leads, and that teaches ad platforms to find people who start forms.
Field choice adds a third. The Crazy Egg roundup puts abandonment at 10.5% for the password field on account-creation forms and 4.3% for the address field. It also cites an analysis of demo-booking forms in which submission success peaked at 51% for four to six fields and fell to 31% at seven or more.
The roundup warns against one popular claim as well. Marketing Charts pointed out that multi-page forms skew toward high-intent uses such as contests while single-page forms skew toward low-intent ones, so the two groups start with different audiences before any design difference applies.
3. Product-page clicks that rise while purchases stay level
An add-to-cart click records interest before any money changes hands. Baymard Institute’s latest quantitative study found that 42% of US online shoppers have abandoned a cart because they were browsing and not ready to buy.
Among the reasons a store can act on, Baymard’s checkout research lists slow delivery at 21% and a checkout process that felt too difficult at 18%. The jewelry store from the introduction showed the same shape in its first phase, with many add-to-carts and checkout starts and no completed payments.
4. Engagement that rises while qualified leads fall
Downloads and webinar sign-ups count as engagement, and both add rows to a lead list. RevOps Report’s April 2026 benchmark page puts demo requests at 40 to 60% conversion from marketing-qualified to sales-qualified, and gated inbound content at 8 to 15%.
A campaign that moves budget from demo-request offers to gated content raises the lead count and lowers the share that sales accepts. Zephra recommends adding a qualifying question to the form and sending the qualified status back to the ad platform, so bidding learns what a buyer looks like.
Where each situation shows up
| Situation | Number that rises | Number to check next | First place to look |
|---|---|---|---|
| Call to action promises more than the page delivers | Clicks on the button | Sign-ups or purchases after the click | The first screen of the destination page |
| Form starts climb | Starts | Submissions that pass spam checks and qualify | The step where the conversion tag fires |
| Product-page clicks climb | Add-to-carts | Completed purchases | Delivery promises and checkout length |
| Engagement climbs | Downloads or sign-ups | Sales-accepted leads | Lead source and CRM status |
Run the Arithmetic Before You Call a Winner
Two published worked examples put numbers on the difference between a click count and a customer count. The first comes from Go Fish Digital and compares two ad sets that each received 100,000 impressions.
| Click-focused ad set | Conversion-focused ad set | |
|---|---|---|
| Click-through rate | 2% | 1% |
| Clicks | 2,000 | 1,000 |
| Conversion rate | 1% | 3% |
| Orders | 20 | 30 |
| Cost per click | $1.50 | $1.80 |
| Spend | $3,000 | $1,800 |
| Cost per customer | $150 | $60 |
The ad set with half the clicks produced 50% more orders, and its cost per customer landed at $60 (Go Fish Digital). It paid more for each click and still cost less to run, since a higher share of its clicks turned into orders.
The second example comes from Zephra and covers a US SaaS demo form with $9,000 a month spent on the same campaigns.
| Form | Demo requests | Cost per request | Qualified rate | Qualified leads | Cost per qualified lead |
|---|---|---|---|---|---|
| 3 fields | 120 | $75 | 25% | 30 | $300 |
| 5 fields (adds company size and use case) | 90 | $100 | 40% | 36 | $250 |
Zephra states the break-even rule this way: at equal spend, a new form wins when the new qualified rate divided by the old qualified rate exceeds the old submission count divided by the new one. Here 40% ÷ 25% is 1.6 and 120 ÷ 90 is about 1.33, so the five-field form wins even though its cost per request is a third higher (Zephra). A second Zephra example, an Indian pump manufacturer spending ₹3,00,000 a month on Google Search, shows a longer form with qualifying questions cutting enquiries from 300 to 200 and cost per qualified lead from ₹5,000 to ₹3,750.
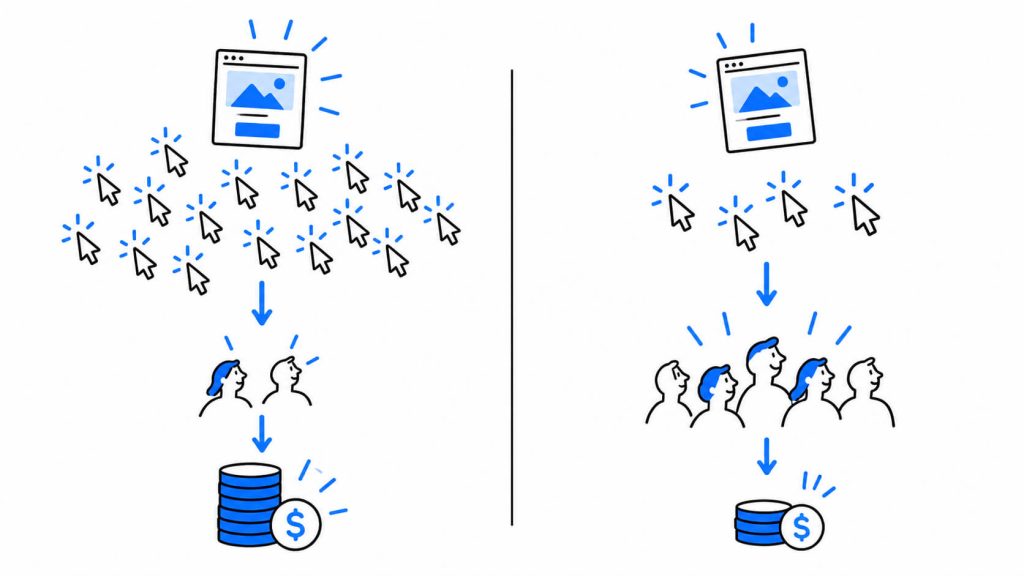
Both sets of figures are worked examples from vendor guides. The arithmetic transfers to your own data, and your own numbers will differ. Collect four numbers for each variant:
- Spend or traffic cost for the test period
- Primary conversions
- Qualified conversions, confirmed by sales or fulfillment
- Cost per qualified conversion (spend ÷ qualified conversions)
More clicks don’t automatically make a better-performing page.
CROLabs helps you run A/B tests against the conversion goal that matters, so you can see whether a change actually improves results instead of just making an engagement metric look better.
Whatever You Measure Becomes the Thing You Get
Economist Charles Goodhart observed in 1975 that a statistical regularity collapses once people apply pressure to control it. Anthropologist Marilyn Strathern later condensed the idea into the line most people know: “When a measure becomes a target, it ceases to be a good measure”.
Ad platforms apply that pressure automatically. Google Ads sorts conversion actions into primary actions, which are used for bidding, and secondary actions, which are for observation only. Whatever sits in the primary column is what automated bidding pursues, so a click-type action marked primary asks the system for clicks.
A/B tests follow the same logic. A test judged on button clicks selects the variant with the most button clicks. The jewelry store owner met a version of this in phase one, when a campaign tracked on add-to-cart produced carts and no payments.
Why Your Primary Conversion Goal Matters
A primary conversion goal is the single action that decides which variant wins or which campaign earns more budget. Every other action you track stays in the report as an observation, which adds context without changing the verdict. Google Ads uses this primary and secondary split. CROLabs’ conversion tracking applies it inside experiments, where one goal per test counts toward conversion rate and the rest are recorded alongside it.
Choosing the goal before the test starts means the team agrees on the deciding metric before results arrive, so the outcome gets read against a rule written earlier. CROLabs offers six goal types (element click, form submission, page visit, scroll depth, time on page, and custom event), and each one can serve as either a primary conversion or an observation.
Applied to the four situations above, the setup looks like this:
- Call-to-action test: the primary conversion is the purchase or booking that follows the click, and the click on the button becomes an observation.
- Multi-step form: the primary conversion is a custom event that fires on the final submission, and step-one starts become an observation.
- Product-page test: the primary conversion is a page visit to the page shown after an order, and add-to-cart clicks become an observation.
- Content offer: the primary conversion is the demo-request form submission, and the download form submission becomes an observation.
Timing matters as well. CROLabs goals record data only from the moment they go active, so the goal needs to exist before the experiment launches, and a run-through in a private browser window confirms that the event fires.
A Five-Point Check Before You Celebrate a Lift
Run these five checks on any test that shows a rise in clicks or form starts.
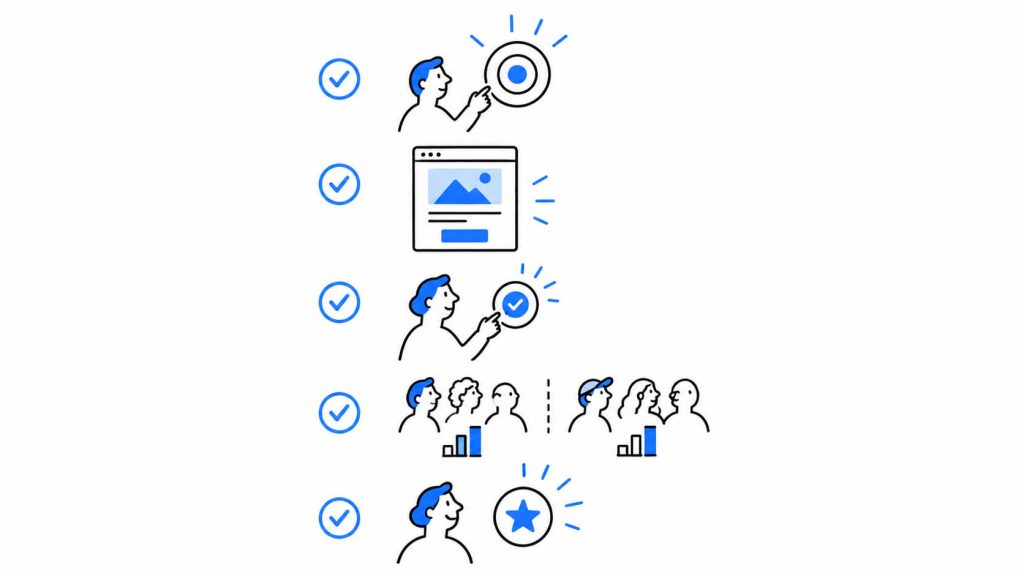
- Name the primary conversion. Write it down before the test starts, and record click-type metrics as observations.
- Read the first screen. Open the destination page from the ad or button, then compare its first screen with the promise that earned the click (Go Fish Digital).
- Test the tag. Complete the conversion yourself in a private browser window and confirm the event fires on the final step (Zephra).
- Split the result. Break it down by traffic source and device, then compare like with like. Adobe recommends channel-level conversion rates, and the multi-page form example above shows how audience differences produce apparent winners.
- Wait for statuses. Give sales or fulfillment time to mark orders or leads from both variants, since newer leads look worse than older ones, then compare cost per qualified lead (Zephra).
Conclusion
Open the test that’s running right now and read its goal setting. If the goal is a click, add the purchase or booking that follows it as the primary conversion and move the click to observations. In CROLabs, that means creating the goal in the Goals tab and choosing primary conversion or observation, and the free plan includes all six goal types.
You can set up a first goal from a free CROLabs account.
Know which number should decide your next test?
Set up your conversion goal in CROLabs, run your experiment, and measure the action that actually matters to your business.
FAQs
Is a high click-through rate a bad sign?
A high click-through rate shows that an ad or button attracts the people who see it. Read it next to conversion rate and cost per customer to see whether those clicks lead to purchases or qualified leads. Go Fish Digital treats click-through rate as a diagnostic signal and looks at downstream steps such as add-to-carts and purchases as the evidence of success (Go Fish Digital).
What is a primary conversion goal?
It is the one action that decides the winner of a test or the target of a campaign’s bidding. Google Ads calls the other tracked actions secondary and uses them for observation only (Google Ads Help).
Should I stop tracking clicks?
Clicks stay useful as observations. Secondary conversion actions in Google Ads exist for this purpose: a PDF download, for example, can explain the customer journey and support a remarketing audience (One PPC).
How long should a test run before I pick a winner?
Zephra’s test plan waits until sales has reviewed leads from both versions, treats a result as directional until each version has a few dozen qualified leads, and confirms the winner over a second period (Zephra).
Why did my conversion rate fall after traffic grew?
Conversion rate divides orders by visits, so new traffic that converts poorly lowers it even when total orders hold steady or rise. Adobe suggests checking conversion rate by channel and comparing visits that viewed more than one page (Adobe).