Updated June 2026
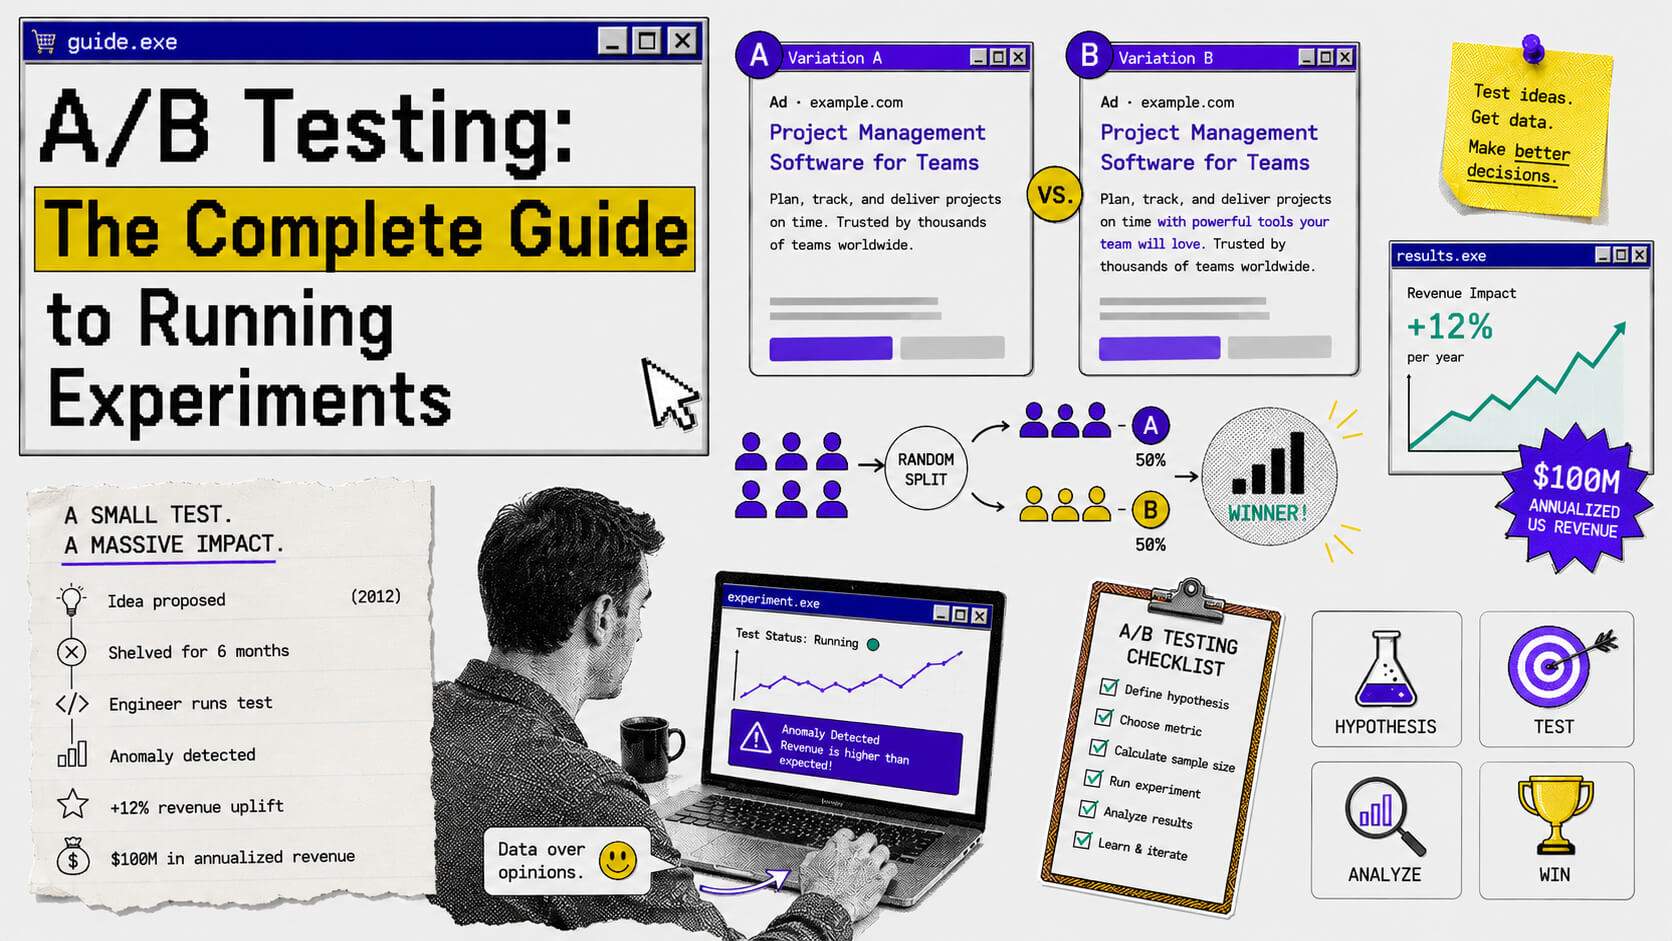
In 2012, a Microsoft engineer had a small idea. He wanted to extend ad headline text in Bing search results by pulling in words from the description line below, but his team shelved it and program managers called it low priority. For six months, nobody touched it.
Then one engineer, noticing the code would be easy to write, ran it as a test on a slice of Bing users. Within hours, the system flagged an anomaly: revenue was climbing at a rate that triggered an automated “too good to be true” alert. This alert is the kind that usually means there’s a billing glitch.
There was no glitch. The headline change had increased Bing’s revenue by 12% per year. That single A/B test turned into $100 million in annualized US revenue from a change one engineer built in a matter of days.
The assumptions your team runs on and the things everybody nods at in meetings are often wrong. But with testing, you find out which one actually works.
On This Page
What Is A/B Testing?
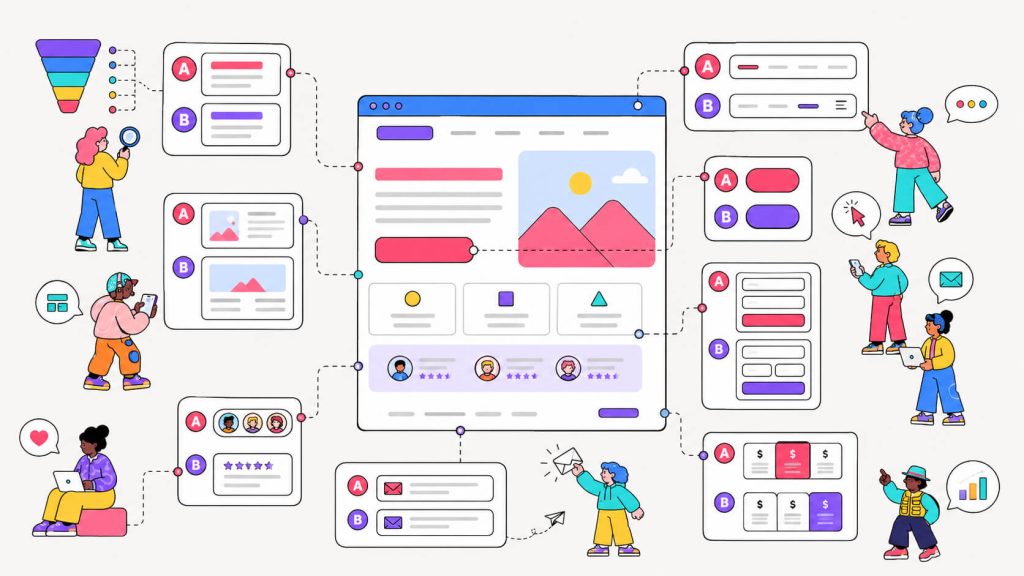
A/B testing, also called split testing, is an experiment where you compare two versions of a digital asset (a webpage, email, ad, landing page, or CTA button) to find out which one performs better with real users.
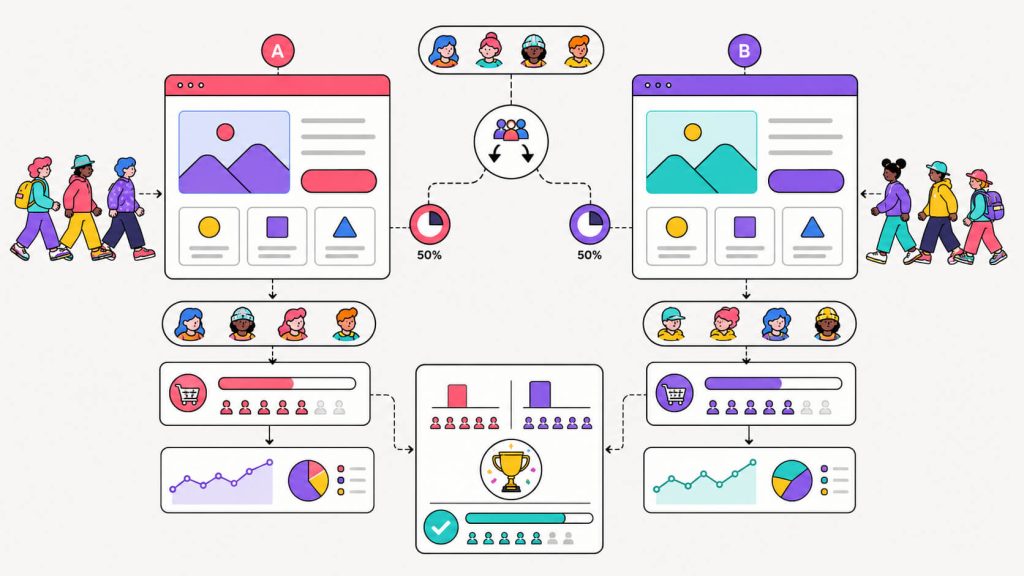
You have a control, Version A, which is the original. And you have a variant, Version B, which is the change you want to test. Traffic gets randomly divided between the two. Some users see A. Others see B. After enough data comes in, you compare results against your goal (it can be signups, purchases, clicks, time on page, etc) and you have your answer.
The word “randomly” is doing a lot of work in that explanation. If you showed Version B only to users from paid ads and Version A to organic traffic, you’d never know whether the results came from your design change or just from different audience quality. Randomization creates a clean split, which removes bias and leaves you with clean data.
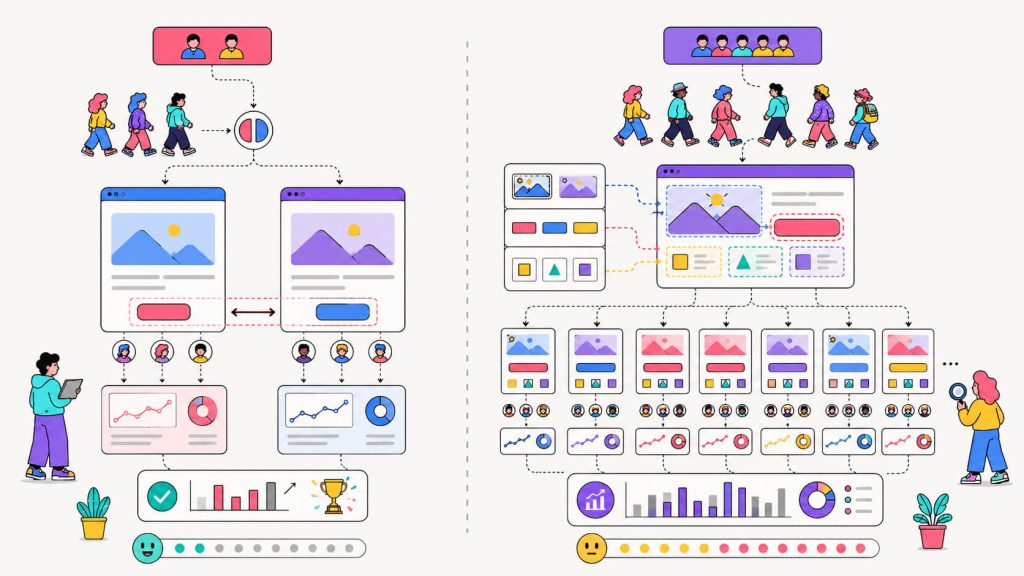
A/B Testing vs Multivariate Testing
Multivariate testing takes a different approach. Where A/B testing isolates one change at a time, multivariate testing runs multiple variations of multiple elements simultaneously. Headline, CTA button, and hero image are common examples of these elements and multivariate tests run them all at once.
Multivariate testing is more complex, it needs significantly more traffic to be statistically meaningful, and it reveals how different elements interact with each other.
A/B testing and multivariate testing are both core methods in conversion rate optimization (CRO), the practice of increasing the percentage of visitors who take a desired action on your site. Most teams start with A/B testing since it’s best practice. Multivariate testing is what you graduate to once you have more traffic volume combined with the discipline to handle it.
Why Is A/B Testing Important? (Especially in CRO)
The uncomfortable truth about conversion rate optimization is that most of what you think will work, won’t. This is mainly because user behavior is genuinely counterintuitive, and no amount of expertise fully accounts for it.
1. It corrects wrong instincts
Everyone on Obama’s 2008 campaign team loved the videos they’d produced. The team had invested real time and creative energy in them. When they ran an A/B test on their campaign splash page, testing CTA button copy and media (images vs. videos) against each other, every single video variation lost to static images.
The winning combination was a family photo paired with the “Learn More” button instead of the original “Sign Up” text. Sign-up rate jumped from 8.26% to 11.6%. That 40.6% improvement contributed an estimated $60 million in additional campaign donations from approximately 2.88 million new email sign-ups.
Nobody predicted that outcome, and that’s exactly why you test.
2. It changes decision making structure
The case for testing isn’t just that it corrects wrong instincts. It also changes the structure of how decisions get made.
When your CEO says “I think the green button will work better,” you have a choice: nod and ship it to 100% of users, or run a test. If you test, the users decide, and the deciding mechanism becomes based on evidence (data) instead of opinion.
3. It improves conversion rate
The wins also stack in ways that catch teams off guard. A 4% improvement to homepage conversion, then a 3% improvement to the checkout form, then a 5% improvement to CTA copy all compound. Over six months of consistent testing, a disciplined experimentation program improves conversion rate and moves revenue in ways that no single campaign or redesign typically does, because those gains persist and build on each other.
4. It limits downside risks
Testing also limits downside risk in a way that feels counterintuitive at first. Redesigning your homepage on instinct and shipping it to all your traffic is a bet. A/B testing the redesign first means that if the new version performs worse, only a fraction of users saw it before you rolled back. You’re taking big risks in small, controlled doses.
And you learn things you wouldn’t otherwise learn. Your actual users (the ones clicking through your site right now) are rarely the users you imagined when you built the product. Testing teaches you who they actually are.

Not Sure What to Test First?
One of the biggest reasons A/B testing fails is testing random ideas instead of real friction points.
CROLabs’ AI Advisor analyzes your pages, highlights conversion bottlenecks, and recommends high-impact tests based on actual user behavior.
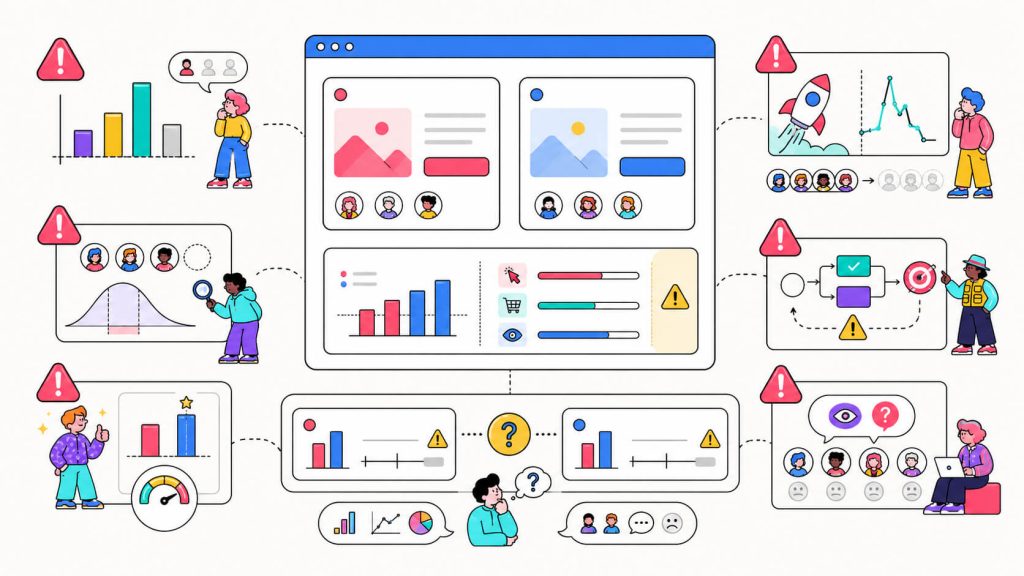
Limitations (or Cons) of A/B Testing
A/B testing is regularly misapplied. A test run badly gives you false confidence, which is worse than no data at all.
The traffic problem
This is a common con for most websites. If you’re getting a few hundred visitors a month, an A/B test might need months to reach statistical significance. By then, seasonality has changed and the data is compromised.
Simply put, running tests on underpowered traffic gives you false “insights”.
It only optimizes locally
An A/B test tells you whether Version B is better than Version A. It can’t tell you whether there’s a Version C you haven’t imagined that would beat both. You can keep winning small optimization battles (a 3% lift here, a 5% lift there) while missing a fundamentally better approach you never thought to test.
Pro Tip:using AI powered tools like CROLabs tells you exactly what that fundamentally better version C (and D and E and F and… you get the drift) is.
It doesn’t tell you why
If you run a headline test and one version wins by 20%, was it the specificity of the claim, the verb choice, the length? Without qualitative data, like session recordings, alongside your quantitative results, you’re getting answers without understanding. That makes it hard to apply the learning anywhere else.
The novelty effect
Users sometimes respond differently to a new version simply because it’s unfamiliar. So if you end the test too early because the result looks exciting, you might declare a false winner. Pre-setting a minimum duration and sample size before you start is non-negotiable.
Not every problem is a testing problem
If your bounce rate is high because your traffic is misaligned with what you’re selling, no A/B test will fix that. Testing is for optimization, not for solving product-market fit problems. Know the difference before you start running experiments.
None of this is a case against testing. It’s a case for running tests with intention and reading results with healthy skepticism.
Key Metrics to Track During an A/B Test
The metrics you track depend on what you’re testing and what you’re optimizing for.
Conversion Rate
The percentage of users who completed your desired action: signup, purchase, form submission, download. This is the primary metric for most tests. If you’re running a CTA button test, conversion rate is what you’re there to move.
Bounce Rate / Exit Rate
The percentage of users who left without engaging further. Especially useful when testing landing pages or entry points. If your variant drops the bounce rate while also improving conversions, that’s a strong, coherent signal.
Click-Through Rate (CTR)
The core metric for email subject lines, CTA buttons, and paid ads. CTR and conversion rate often move together, but not always. A variant might get more clicks but fewer completed purchases.
Revenue Per Visitor
The more useful ecommerce metric over conversion rate alone, because it accounts for order value. A version converting at 7% with a high average order value can outperform one converting at 10% with a low AOV.

Statistical Significance
This is a validity metric. It tells you whether your result reflects a real difference or random variation. The standard is 95% confidence before calling a winner. Below that, you’re looking at noise and making decisions based on it.
Time to Significance / Sample Size
Tracks how long you’ve been running the test and how many users have been exposed to each variant. An underpowered test will mislead you even when the numbers look decisive.
Elements You Can A/B Test
Almost anything on your website or in your funnel is testable. But some elements consistently produce more meaningful results than others.
Headlines and Body Copy
This is where you, and most teams, should start. Headlines get decided on in seconds, and users are making their stay-or-leave calculation before they’ve read anything else on the page.
A specific headline almost always beats a vague one. If you want proof of this, test “Increase E-Commerce Conversions by 25% in 90 Days” vs. “We Help Businesses Grow” and see what happens.
Copy changes tend to produce outsized results relative to the effort required to test them.
CTA Buttons
The copy, color, placement, size, and contrast of your CTA button are all testable. The Obama campaign tested four button variants. “Learn More” beat “Sign Up,” “Join Us Now,” and “Sign Up Now.” The lowest-friction framing won.
Page Layout and Structure
Hero section design, image vs. video above the fold, single-column vs. two-column layout, how much information appears before a CTA. Sometimes a cleaner, simpler page outperforms a feature-rich one, sometimes the opposite. The only way to know is to test.
Forms
One of the most documented tests in CRO history came down to a checkout form and a single button label. One word produced $300 million (more on that below.)
Some changes you can make in a form are the number of fields, the field labels, single-step vs. multi-step layout, and where the form appears on the page.
Social Proof Elements
Examples of social proof elements are testimonials, client logos, star ratings, review counts, case study snippets.
Additionally, the presentation (not only the presence) of social proof changes behavior. WorkZone changed their client testimonial logos from color to black and white and saw a 34% lift in form completions.
Email Subject Lines
Obama’s re-election team ran over 500 A/B tests across email in 20 months. In one test alone, the difference between two subject lines of the same email was $2.1 million in donations. Email subject lines are one of the most underused testing opportunities in marketing, given how much is riding on them and how easy they are to test.
Pricing Pages
Pricing page tests have direct, measurable revenue impact. You can run tests on plan naming, feature emphasis, price anchoring, how you frame your free trial.
Navigation and Site Structure
How easy it is for users to find what they’re looking for? High-friction navigation is often a silent conversion killer because users abandon before reaching the conversion point.
A/B Test Examples
Let’s look at some real tests with documented, verifiable results.#

1. Obama’s 2008 Campaign – The $60 Million Landing Page
The Obama digital team tested 24 combinations of CTA button copy and media (three images and three videos) on their campaign splash page. The team’s instinct was that videos were more engaging, but they were wrong. Every video variation lost to images.
The winning combination was a family photo paired with a “Learn More” button, and it took sign-up rate from 8.26% to 11.6%, a 40.6% lift. That single test contributed approximately 2.88 million additional email addresses and an estimated $60 million in donations.
If we do the math, we see that each email address on the list donated an average of $21 over the life of the campaign.
🔗 Full case study documented by Dan Siroker at Optimizely
2. Microsoft Bing – The $100 Million Headline
An employee proposed extending Bing’s ad headline text by merging it with text from the description line below, creating a single, longer headline. The idea was called low priority and shelved for months. When one engineer finally coded it and ran it as an A/B test, the system triggered an automated revenue alert within hours.
The headline modification produced a 12% revenue increase. This was the highest-value single idea in Bing’s history at that point, worth over $100 million in annualized US revenue.
Microsoft now runs over 10,000 controlled experiments per year across Bing alone.
🔗 Harvard Business Review breakdown
3. The $300 Million Button – One Word
A large e-commerce retailer (documented by UX researcher Jared Spool) had a checkout flow that forced users to register before purchasing. First-time buyers hated it because the register prompt felt like “entering into a relationship” when they just wanted to buy something. Many users abandoned rather than create an account.
The retailer changed the button label from “Register” to “Continue,” and added this line of text: “You do not need to create an account to make purchases on our site.”
The result was a 45% increase in purchases, $15 million in additional revenue in the first month, and $300 million by the end of the year.
4. WorkZone – The Cost of Colorful Logos
WorkZone added client testimonial logos next to their demo request form to build trust through social proof. The logos were colorful and prominent. But they were competing with the form itself, drawing attention away rather than reinforcing a decision to sign up.
WorkZone tested replacing the color logos with black-and-white versions, which are less visually dominant.
The grayscale variant produced a 34% increase in form submissions at 99% statistical significance.
5. Zalora – Making the Free Returns Policy Visible
Zalora, a major Asia-Pacific fashion retailer, found through customer service data that users weren’t aware of the brand’s free return policy. The policy existed quite alright, but it was not prominent enough on product pages to influence buying decisions.
After A/B testing a redesigned product page that surfaced the free returns information more visibly, Zalora saw a 12.3% increase in checkout rate.
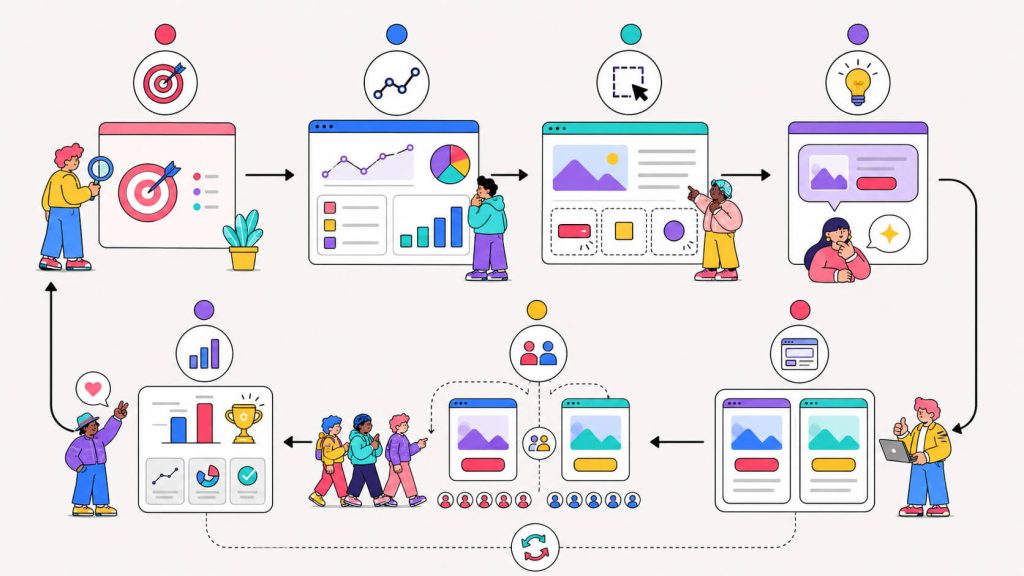
How to Perform an A/B Test
Good A/B testing is rarely about complexity and more about discipline. Here’s a quick way to perform an A/B test that yields reliable results.
1. Choose a goal for your test
The test’s goal should be tied directly to your marketing goals. For example, if you are planning a campaign to increase signups for a webinar and want to test the landing page copy, your goal could be to maximize clicks on the “Sign Up” button.
2. Start with data
Before you form any hypothesis, look at what’s already happening on your site. You should look at where users are dropping off, which pages have unusually high bounce rates, what your conversion funnel look like in your analytics tool, etc.
Your test hypothesis should come from observed behavior. If a large percentage of visitors land on your pricing page and leave without converting, that’s the data you should use to form your hypothesis.
3. Choose what to test
Choose a single element on the landing page to modify for testing. In our example, we could test alternative headlines, different button text, or even colors.
A useful hypothesis follows this structure: “If we change [X], then [metric Y] will [increase/decrease] because [reason Z].”
Example, “If we change our CTA from ‘Sign Up’ to ‘Start Free Trial,’ sign-up conversion rate will increase because it communicates lower commitment and sets clearer expectations.”
4. Create your test variations
To prepare your test, create two versions of the page, the original page and a modified version with a potential improvement.
5. Run the test
To start your test, use a testing tool to divide your traffic evenly between the two landing pages.
Your test should run long enough. Traffic patterns vary significantly by day of the week and seasonality affects results, so your tests should go for two complete business cycles at minimum. For most B2B and SaaS sites, that means two weeks.
6. Analyze your test results
After running your test for a predetermined length of time, review the results and choose a winning variation.
7. Repeat testing
The only way to get even better results is by testing and tweaking each element on the page. You especially want to experiment with key elements like call-to-action buttons, headlines, images and the copy surrounding them.
A/B Testing with CROLabs
A lot of teams struggle with actually running tests because the tool gets in the way.
The most common blocker is developer dependency. If every test requires a ticket and a sprint slot, testing cadence dies. You end up running two or three tests per quarter when you should be running ten.
CROLabs removes that bottleneck. The visual editor lets you build test variants directly on your live website without writing code. You can edit copy, restructure page sections, swap elements, adjust layouts, and launch A/B or multivariate tests without touching your codebase or waiting on a developer queue.
The AI Advisor is what distinguishes it from standard testing tools. It crawls your site, benchmarks pages against industry performance data, identifies where you’re losing conversions, and surfaces a prioritized list of what to fix and test first.
This is useful because one of the consistent time-wasters in any testing program is debating where to start. The AI Advisor makes that a data question instead of a judgment call, so the first test you run is on something that’s actively costing you conversions rather than something someone had a feeling about.
CROLabs also includes conversion tracking, session analytics, and a personalization layer so once you identify a winning variant, you can serve it specifically to the segments that responded best to it.
You can learn more about CROLabs’ a/b tests here. Your first test can go live the same day you sign up.
What the Meetings Can’t Decide
None of the outcomes/examples above were reasoned out in advance. They were discovered, because someone ran a test instead of trusting a consensus.
If you have real traffic and real users, a/b testing is the most reliable method for turning that traffic into conversions consistently, compoundingly, and over time.
Your Next Conversion Win Is Probably One Test Away
FAQ
What’s the difference between A/B testing and multivariate testing?
A/B testing compares two versions of a single element or page. Multivariate testing runs multiple variations of multiple elements simultaneously to see how combinations interact. Multivariate testing requires significantly more traffic to reach statistical validity. If you’re starting out or if your traffic is limited, A/B testing is the right call.
How long should you run an A/B test?
At minimum, two full business cycles or two weeks for most sites. Don’t cut tests short because early data looks promising. Early results in A/B testing are almost always misleading due to novelty effects and day-of-week variation.
What is statistical significance and why does it matter?
Statistical significance tells you whether your test result reflects a genuine difference in performance or just random variation. The standard threshold is 95% confidence, which means there’s a 5% or lower chance the result was due to chance. Calling a winner below this threshold means you’re likely acting on noise.
Can you run multiple A/B tests at the same time?
Yes, but carefully. Concurrent tests can interfere with each other if they share the same user pool or overlap on the same pages. To avoid this, either run tests on separate pages or set them up on non-overlapping audience segments.
What should I test first?
Start at the highest-traffic, lowest-converting point in your funnel. That’s where a win will have the most impact. Within that page, test your main headline or CTA button first, both consistently produce the most meaningful results relative to the effort of setting up the test.
My website doesn’t get much traffic. Can I still A/B test?
Yes, but with realistic expectations about timelines. A low-traffic site takes longer to reach statistical significance. In the meantime, prioritize changes backed by behavioral data from session recordings or heatmaps. And don’t end tests early just because you want an answer, inconclusive data from an underpowered test is worse than no test at all.
What’s the difference between a high bounce rate and low conversion rate?
Both signal a problem, but at different points in the user journey. A high bounce rate means users are leaving without engaging at all. A low conversion rate means users are exploring but not taking the action you want. The fix for each is different, which is why understanding user behavior through analytics before you test matters.
Does A/B testing work for email campaigns too?
Yes, and it’s one of the most underused testing opportunities in most marketing stacks. Subject lines, preheader text, send time, email copy, CTA placement, and even sender name are all testable. Obama’s 2012 re-election campaign ran over 500 A/B tests across email in 20 months, increasing donation conversion by 29% and sign-up conversions by 161%. The cost per test is low and the impact can be immediate.
Stop guessing. Start learning what truly makes your visitors convert, with evidence.