Updated Oct 2026
In the early 1930s, Harry Beck redrew the London Underground map with straight lines that no longer matched the true shape of the tunnels under the city. He built the diagram around the two things he thought a traveler wanted to know, which were how to get from one station to another and where to change trains. The first pocket edition went out in 1933 with a note on the cover inviting comments, and the design still sits underneath the Tube map people use today.
A customer journey map is built around a similar pair of questions. In what order does a buyer move through your business, and where does one step hand them to the next? This guide covers what a journey map is, what goes into one, how to build yours, and how to keep it in use after it exists. It also shows where CROLabs fits, since a map is most useful when each stage on it connects to something you can test.
In short
- A customer journey map is a diagram of the steps a buyer takes with your business, written from the buyer’s side.
- Each stage records actions, questions, emotions, and the points where something goes wrong.
- The map starts with customer language (support tickets, interviews, forum threads) and gets checked against behavior data.
- Every pain point on the map becomes a hypothesis you can run as an experiment.
On This Page
What is a customer journey map?
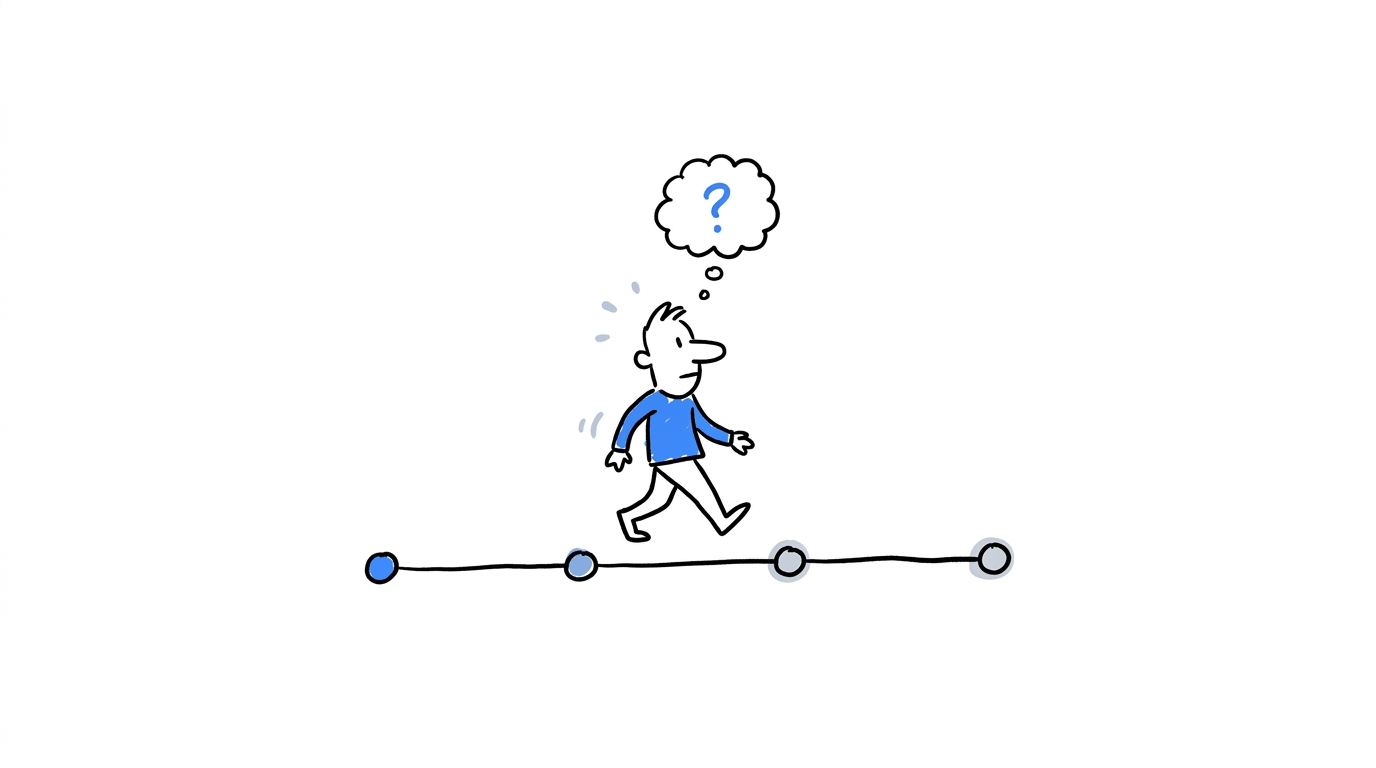
A customer journey map is a diagram of the steps a person goes through with your business, from the first time they hear about it to the point where they renew or leave. Each step carries notes on what the person did, what they were trying to get done, how they felt, and where something got in their way.
A sales funnel looks at the same stretch from the company’s side and counts how many people arrive at each stage, and the journey map adds the buyer’s actions and feelings at each of those stages. That extra layer is what makes it useful for conversion rate optimization, because a drop in a number only becomes actionable once you know what the person was experiencing when they dropped off.
Customer journey maps often use a horizontal timeline, with each stage arranged from left to right. Below the timeline, separate rows provide more detail about what happens at each point, including the customer’s actions, thoughts, emotions, and any obstacles they come across.
Customer journey map vs. related diagrams
| Diagram | Viewpoint | What it shows | Best used for |
|---|---|---|---|
| Sales funnel | Company | Counts of people at each stage | Reporting conversion by stage |
| Customer journey map | Buyer | Actions, questions, and emotions across stages | Finding friction and deciding what to fix first |
| User flow | Product | Screens and clicks inside one interface | Designing or debugging a specific task |
| Service blueprint | Buyer and company | The journey plus the internal processes behind each step | Fixing handoffs between teams |
Why is a customer journey map important?
A buyer experiences your business as one continuous relationship. Someone who reads a blog post and later contacts support in week two remembers both as the same company, so the quality of the whole sequence shapes what they decide.
McKinsey found that a company’s performance on complete journeys is 35 percent more predictive of overall customer satisfaction than its performance at individual touchpoints. The same research estimated that improving satisfaction across journeys can raise revenue by up to 15 percent and lower the cost of serving customers by as much as 20 percent.
A McKinsey case study on a global bank shows the scale of the effect. Analysts ranked the bank’s journeys by their likely impact on satisfaction before any design work started. Within three years, customers’ annual spend rose by $2.3 billion and satisfaction climbed 28 percentage points, which moved the bank into the top three among ten leading global banks.
For a team focused on conversions, a journey map pays off in five specific ways:
- It gives every drop-off a position on the timeline, so a high bounce rate on one page connects to the stage and the buyer question behind it.
- It puts marketing, product, and support in front of the same picture.
- It lists the moments where buyers feel worst, which sets the order for what to test.
- It exposes stages nobody owns.
- It turns vague complaints such as “the trial feels confusing” into a stage, a touchpoint, and a testable change.
Turn customer journey insights into experiments
Found a point where visitors hesitate or leave? CROLabs gives you the tools to test changes to your pages, compare variations, and see how visitors respond. Use the Visual Editor to make changes without developer involvement, then run an A/B test to measure the results.
Elements of a customer journey map
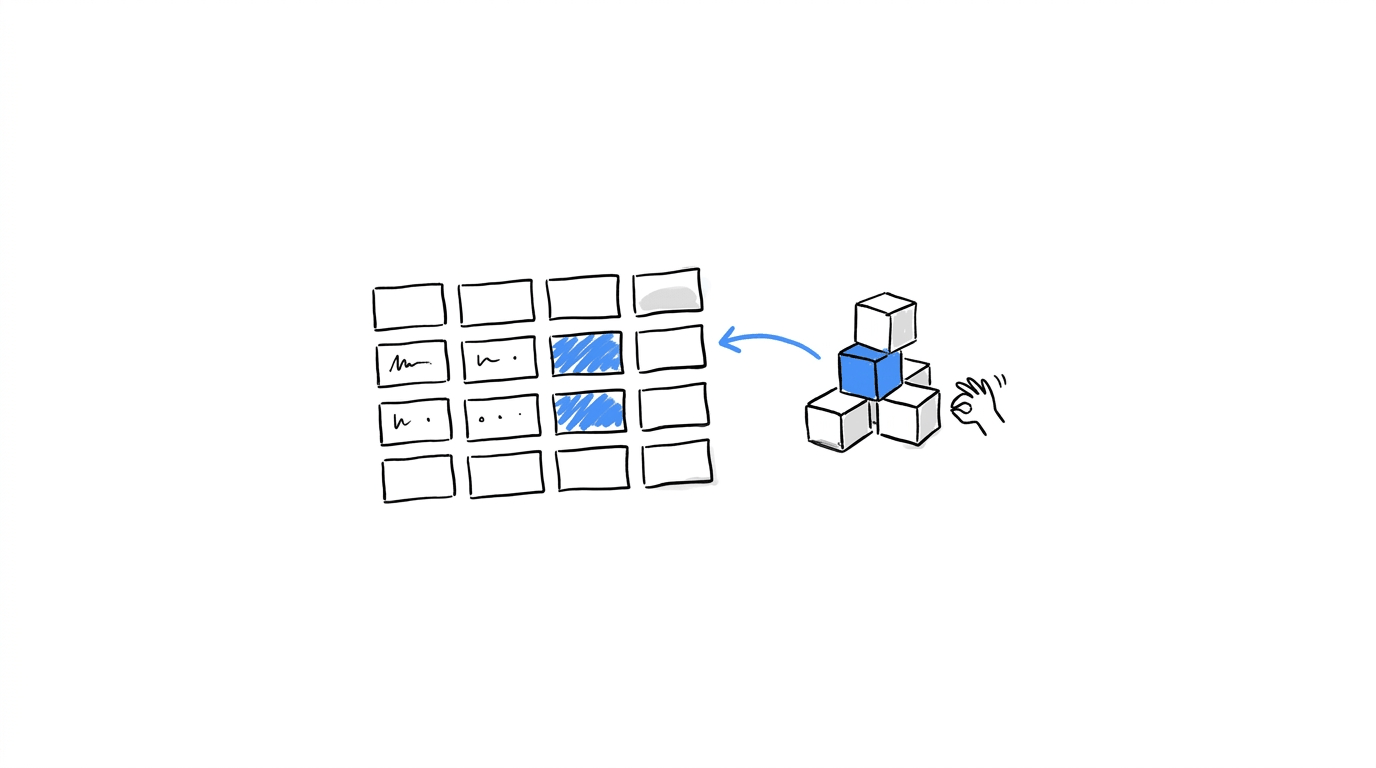
Maps vary in layout, but the same building blocks appear in almost every good one. You can build the grid in a spreadsheet, a whiteboard tool, or a slide.
| Element | What goes in it | Question it answers |
|---|---|---|
| Persona | A specific buyer type with goals and context | Whose experience is this? |
| Scenario and goal | The task the persona wants done | What are they trying to achieve? |
| Stages | The phases from first awareness through retention | Where are they in the process? |
| Touchpoints | Every place they meet your brand: ads, site pages, emails, demos, support chat | Where does the contact happen? |
| Actions | What the person does at each stage | What do they do next? |
| Thoughts and questions | Doubts and questions, written in their own words | What are they wondering? |
| Emotions | A rating for each stage, plotted as a line | How does it feel? |
| Pain points and opportunities | Friction, plus the change you could test | What needs attention first? |
| Owners and metrics | The team and number tied to each stage | Who acts, and how will we know it worked? |
A starting set of stages
Your own stages should match how your buyers behave. The five below give you a skeleton to adjust.
| Stage | What the buyer is trying to do | Where it shows up |
|---|---|---|
| Awareness | Work out whether a problem has a solution | Search results, social posts, ads, community threads |
| Consideration | Compare options | Landing pages, comparison pages, reviews, demos |
| Decision | Pick one and commit | Pricing page, checkout, sales calls |
| Onboarding | Get the first result | Sign-up flow, welcome emails, setup screens |
| Retention | Decide whether to stay | Product usage, support, renewal emails |
A five-stage layout that matches the pipeline stages your sales team already uses is easier to maintain than a textbook model nobody recognizes.
Types of customer journey maps
- Current state map: It records how the journey works today, using research and data. We recommend starting here because every other format depends on it.
- Future state map: It sketches the experience you want to build, and it works best once the current state exposes what needs to change.
- Day-in-the-life map: It follows a persona across a full day, including the hours when they never interact with your business. It suits products that fit into a broader routine.
- Service blueprint: It adds the internal processes, tools, and teams behind each touchpoint, which makes it the right pick when handoffs between departments cause the friction.
How to create a customer journey map
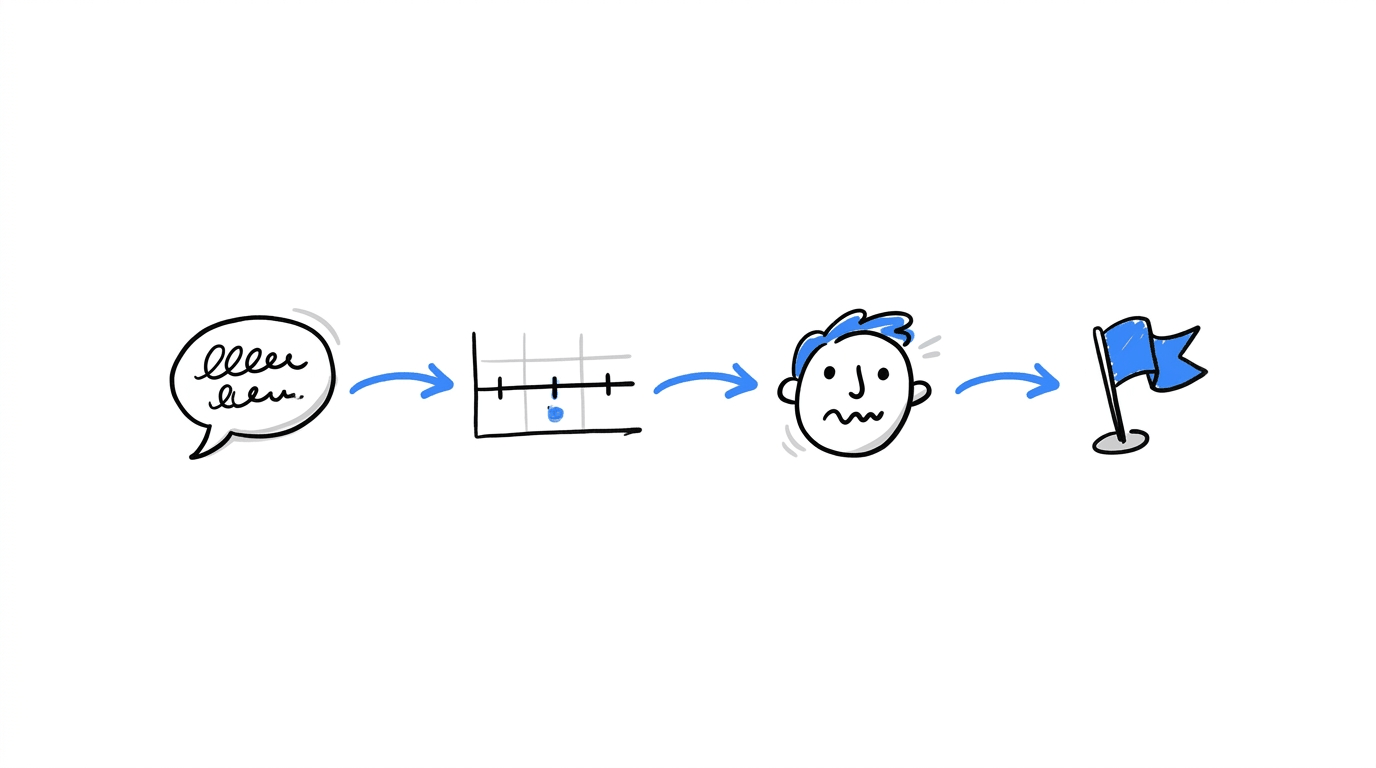
The steps below take a first version from a blank grid to a ranked list of fixes.
- Pick one persona and one scenario: A map of “the entire customer journey” for every buyer at once produces a diagram too crowded to act on. A narrower scope, such as a first-time visitor from paid search who wants to start a trial, gives you something you can finish in a week.
- Collect what customers said in their own words: Pull from the places where buyers describe their experience without being prompted:
- Support tickets and live chat transcripts
- Sales call recordings and notes
- Survey responses and interview recordings
- Session recordings from your site
- Community threads on Reddit, Quora, and niche forums
This step catches stages that an internal workshop skips. One published example describes a call center finding that 30 to 40 percent of inbound calls came from people who already held a competitor’s quote and wanted to negotiate price. That behavior belongs to the decision stage, and nobody had put it on the map because nobody had asked the callers.
- Lay out the stages and touchpoints: Start from the table above, rename stages to fit your business, and list every place the persona meets you at each stage, including the ones you don’t control, such as review sites and forum replies.
- Fill in actions, questions, and emotions: Write the questions as the buyer would say them. Research on journey mapping from UserCall notes that customers describe specific moments, such as one slow reply to an email or an account manager change nobody explained, and the exact detail is what makes a map credible to the people who have to act on it.
- Add behavior data: Customer language tells you what people felt, and analytics tells you where it happened. The Analytics & Heatmaps feature in CROLabs shows where visitors drop off, how far they scroll, and where they click, so each pain point on the map gets a matching signal from real sessions. If you haven’t decided which events to record yet, the guide on which website actions to track walks through the choice.
- Mark pain points, rank them, and assign owners: Give each pain point one metric and one named person. The ranking comes from the emotion line, which the next section covers.
See what’s happening across your customer journey
Customer feedback tells you where people struggle. CROLabs Analytics & Heatmaps helps you see those moments on your website, with scroll depth, clicks, and visitor drop-offs all in one place.
How to read the emotion line
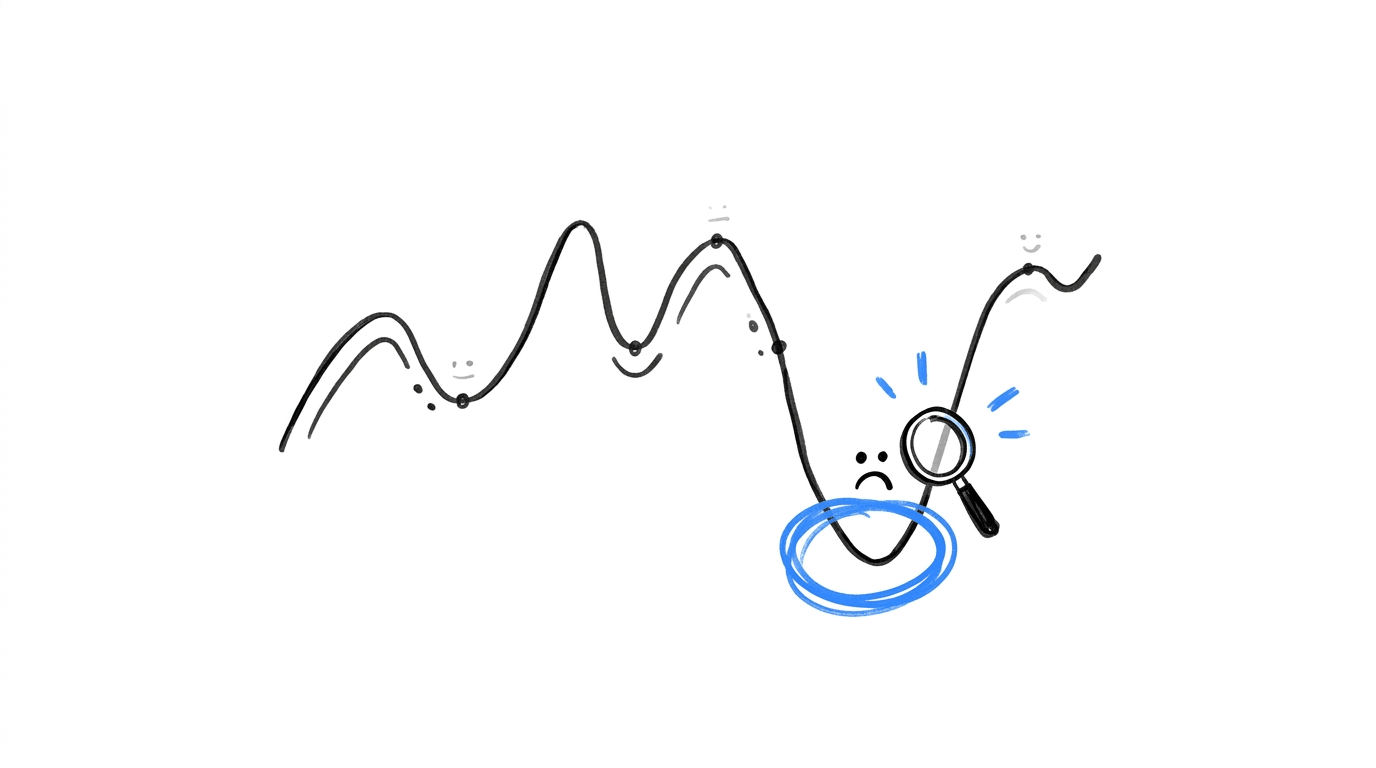
For each stage of the journey, assign an emotion score on a five-point scale, ranging from frustrated to pleased. When you plot these scores on a graph, they form a line that shows how the customer’s feelings change as they interact with the business. A sharp drop in the line draws attention to the point where the experience starts to go wrong.
Start by looking at the stage with the lowest score. This is where customers are having the hardest time, and it could be the point where they decide to abandon the purchase altogether. Improving that part of the journey may have a greater effect on conversions than spending time refining a stage that customers already find satisfactory.
Pay attention to maps where the emotion score stays almost the same from beginning to end. Customer experiences tend to change as people move between stages, so identical ratings across the journey may suggest that whoever created the map relied on their recollection rather than customer research. Smaply’s guidance on common mapping mistakes highlights varied emotion ratings and direct customer quotes as signs that research has informed the map.
Consider an online mattress store as an example. This is a hypothetical scenario, not a real client result. Its customer journey map shows a steep drop in satisfaction after someone places an order. The customer receives an order confirmation, but there’s no delivery estimate or tracking information. Six days pass before the next email arrives, leaving the buyer unsure about when their mattress will show up. Meanwhile, customers keep returning to the order status page several times a day, and the support team gets repeated enquiries about delivery dates. The store can address this by displaying an estimated delivery window on the confirmation page. It can then run a test to see whether this change reduces repeat visits to the status page and the number of support requests.
From map to experiments with CROLabs
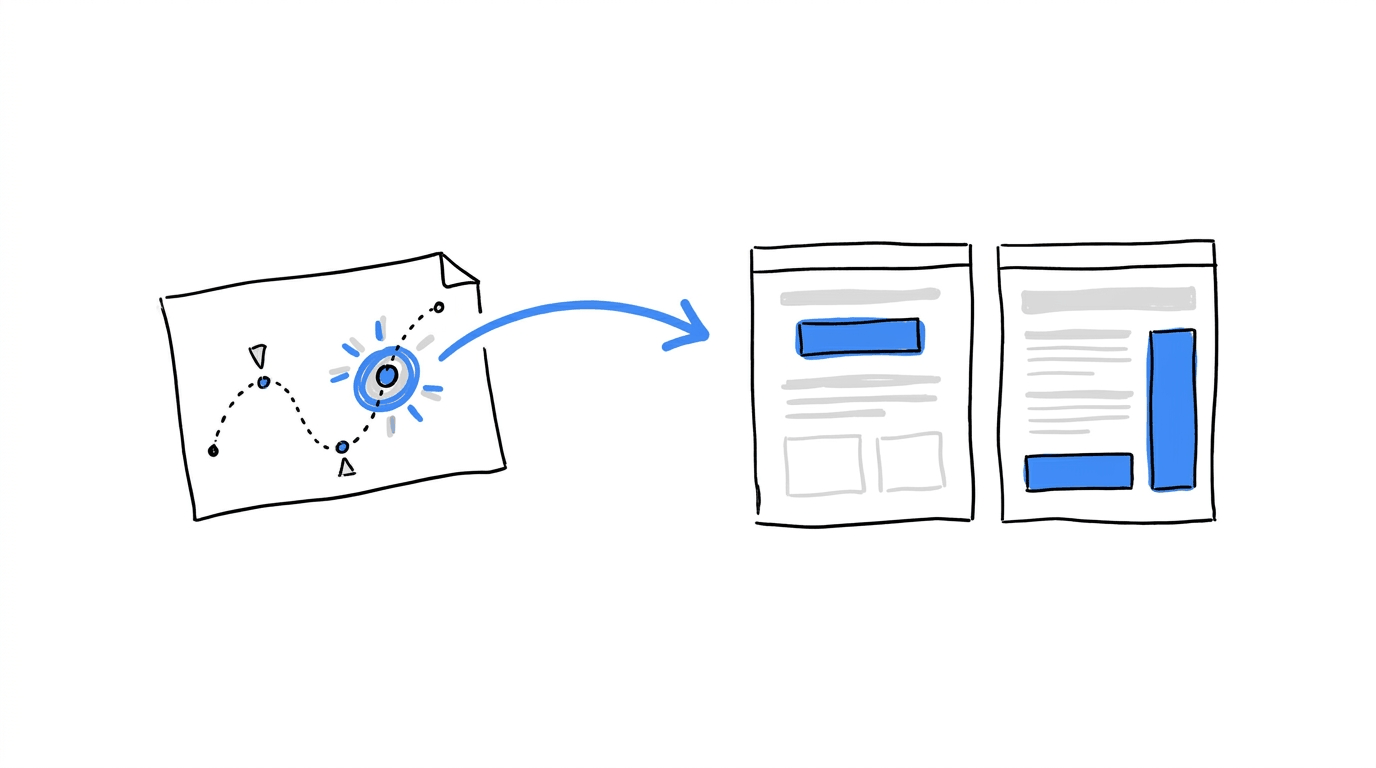
A map that ends in a list of observations gets read once. A map that ends in a list of experiments gets used. Each pain point is a hypothesis about what the buyer needs, and CROLabs lets you test it without waiting on a developer.
| Stage on the map | Signal to look for | CROLabs feature | Test to run |
|---|---|---|---|
| Awareness | Visitors from an ad land on a general page and leave | Ad-to-Page Personalization | Match the headline to the promise in the ad |
| Consideration | Scroll depth falls off below the hero | Analytics & Heatmaps and the Visual Editor | Rewrite the hero headline and split traffic |
| Decision | Exits cluster on the pricing page | A/B Testing and Multivariate Testing | Vary the plan layout and the guarantee message |
| Onboarding | Sign-ups start and go unfinished | Conversion Tracking | Trim form fields and compare completion rates |
| All stages | A long list of possible fixes | AI Advisor | Work from its prioritized list |
Suppose the map for an invoicing tool shows buyers moving from the pricing page to the documentation and then leaving. The question in their heads is probably about setup time, so a short setup timeline near the plan cards becomes the first test. If the stage involves interest you haven’t confirmed, a fake door test tells you whether buyers want the feature before you build it. Audience Personalization then lets you show returning visitors a different message from first-time visitors, which matters because the two groups sit at different stages of the same map.
The order of the work matters too. Tests that come from a map feed straight into a CRO roadmap, and the post-click experience after an ad or email usually holds the first stage worth testing.
What happens to a journey map after the workshop ends?
Many maps stop being used within a few weeks of being finished. A CustomerThink article reports that almost two-thirds of journey maps fail to drive change and quotes a customer experience VP who estimated that about 70 percent of the effort came after the map was complete.
Practitioners in community forums describe the same pattern. One commenter in r/customerexperience, quoted by SurveySparrow, said maps fade when they become “a one-time workshop artifact” that is cut off from live customer feedback.
Four habits keep a map alive:
- Name one owner: A map belonging to “the CX team” or “everyone in the workshop” belongs to nobody in practice.
- Bring the map to a meeting that already exists: Choose a planning or review meeting where one pain point applies, and open with it in the first week.
- Attach every pain point to a metric and a test: A pain point without a number can’t be shown to have improved.
- Schedule a review: Product changes, new campaigns, and shifts in buyer behavior make a map outdated within weeks, so a quarterly update keeps it accurate. Teams that skip it build up experimentation debt as the map and the live site drift apart.
Conclusion
A customer journey map gives a team one shared picture of what a buyer goes through, and its value shows up in the decisions that follow from it. Start with one persona and one scenario, build the first version from customer language, check it against behavior data, and tie each pain point to a test.
CROLabs covers the second half of that work. Analytics & Heatmaps show where the map’s pain points happen on your site, the Visual Editor and A/B Testing let you try fixes without developer time, and the AI Advisor ranks what to fix first. You can see how it fits your own pages with the 14-day free trial, which needs no credit card.
FAQ about customer journey mapping