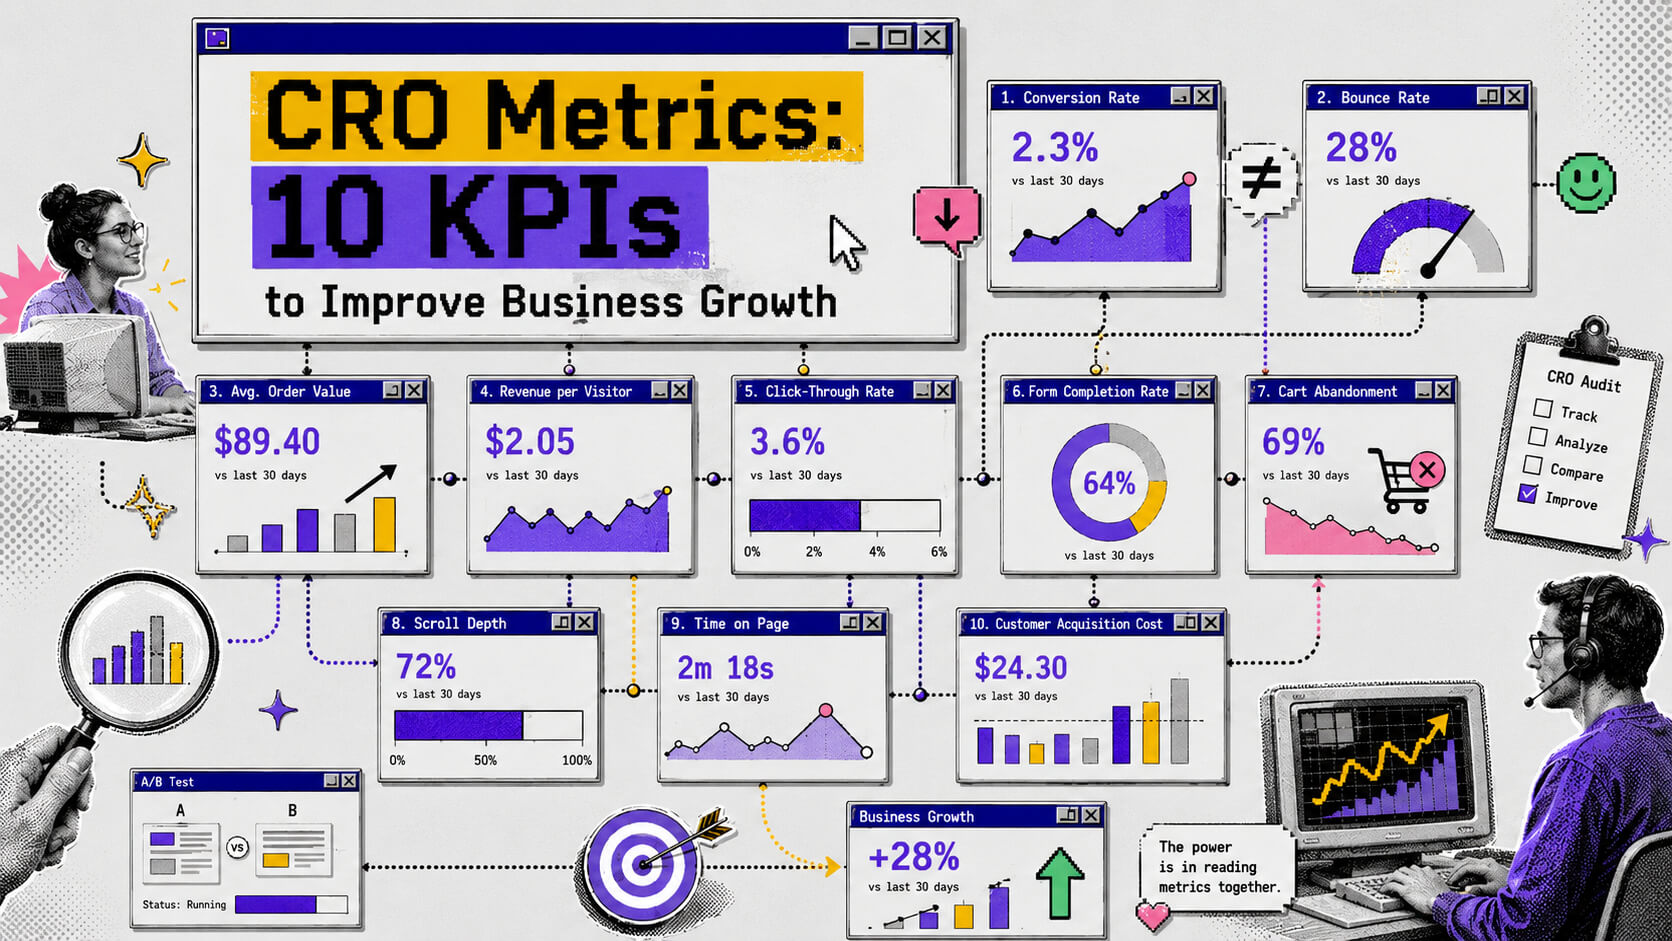
Anything you do to improve your chances of getting your customers or website visitors to convert is known as conversion rate optimization. If you want to know how effective those measures you’re taking are, you’ll need to track how they’re performing.
In all your tracking, however, keep in mind that conversion rate optimization is a small system of numbers, and most of them only make sense next to each other.
For example, you may have a low bounce rate on a page but that page rarely converts. The bounce rate (a CRO metric) looks good but the conversion rate (another CRO metric) of the page isn’t and doesn’t make sense for a page with a low bounce rate.
So before you run another A/B test or greenlight another CRO audit, you should get specific about what you’re actually tracking, why it matters, and which numbers belong to your business model versus someone else’s. These are the topics that will be covered in this guide.
On This Page
What Are CRO Metrics?
CRO metrics are the specific numbers you track to measure whether your website, app, or funnel is doing its job, whether that is turning visitors into customers, signups, or whatever action drives revenue for your business.
Notice that’s different from just “website metrics.” Traffic, impressions, and time on page tell you something, sure, but they don’t tell you if any of it is working. CRO metrics are the ones tied directly to conversion, i.e. whether the visitor did the thing you wanted them to do.
That desired action changes depending on your business. For an ecommerce brand, it might be completing a purchase while for a SaaS company, it might be starting a free trial or booking a demo. Either way, the metric that matters is the one connected to that specific action.

Why Should You Track Metrics?
Because guessing is more expensive than you think.
a. To minimize guessing
You may have heard (or thought) “I think this headline is too vague” or “I think people bounce because the page loads slow”. Most CRO decisions are made from gut instinct like these delivered as a hypothesis.
Sometimes these guesses or instincts are right but a lot of times they’re not, and you won’t know which one you’re dealing with unless you’re tracking the metric that would prove or disprove it.
b. To compound growth
There’s a compounding effect here too. If you improve one metric based on real data (say, cutting your cart abandonment rate by fixing a confusing shipping calculator), that gain sticks around. You can then test the next thing, and if it works, that’s an increase stacked on top of the previous one. You should note, though, that this only works if you’re actually measuring the outcome.
c. To preserve what’s already working
Tracking also protects you from your own confidence. Teams that skip a CRO audit and go straight to redesigning tend to break things that were already working, because nobody checked which parts of the funnel were actually fine. Metrics keep you honest about where the real friction is instead of where you assume it is.
And practically speaking, if you’re running experimentation at any real volume, you need a shared scoreboard. Otherwise every stakeholder is optimizing for a different number, and nobody agrees on whether the quarter was good or bad.
Know Which CRO Metrics Are Holding You Back?
Tracking the right metrics is only valuable if you know what they mean. Get a clear picture of your website’s conversion performance and uncover your biggest growth opportunities.
Overview of CRO Metrics
CRO metrics don’t matter equally to every business. A SaaS company doesn’t care about cart abandonment rate and an ecommerce store doesn’t need to track trial-to-paid conversion.
So instead of handing you one long undifferentiated list, here’s how these metrics break down by industry, and within each industry, by how central they are to your decision-making.
Ecommerce
Primary metrics (the ones tied directly to revenue and purchase behavior):
- Conversion rate (visitors who complete a purchase)
- Average order value (AOV)
- Revenue per visitor (RPV)
- Cart abandonment rate
Supporting/secondary metrics (the ones that explain why the primary metrics move):
- Add-to-cart rate
- Checkout completion rate
- Product page bounce rate
- Return/refund rate
- Time to first purchase (for repeat-customer businesses)
Metrics specific to ecommerce:
- Cart abandonment rate: this barely applies outside retail, since it depends on a literal shopping cart step
- Average order value: a SaaS company has a price point, not an “order” so, again, this barely applies outside retail
- Product page conversion rate: how many people who view a specific product actually buy it

SaaS
Primary metrics (tied directly to pipeline and revenue):
- Trial-to-paid (or free-to-paid) conversion rate
- Demo request rate
- Customer acquisition cost (CAC)
- Signup-to-activation rate
Supporting/secondary metrics:
- Signup form completion rate
- Landing page bounce rate
- Time to activation (how long before a user reaches their “aha” moment)
- Pricing page exit rate
Metrics specific to SaaS:
- Trial-to-paid conversion: the entire concept of a “trial” is a SaaS mechanic
- Activation rate: this is about whether someone actually used the core feature, which doesn’t really translate to a one-time ecommerce purchase
- Demo-to-close rate: for businesses with a sales-assisted motion
Overlapping metrics (relevant to both and most digital businesses)
- Conversion rate, even though what “counts” as a conversion differs
- Bounce rate
- CTA click-through rate
- Form completion rate
- Page load time
- Exit rate at key funnel steps
You’ll notice conversion rate and bounce rate show up everywhere. That’s not laziness on our part, they’re genuinely foundational. But how you interpret them changes a lot depending on whether you’re selling a $40 candle or a $400/month SaaS seat.
10 CRO Metrics To Track (Overview Explained)
From the categories above, we’ve pulled ten metrics worth building your reporting around. Some apply broadly while some are industry-specific, and we’ve noted which is which.
1. Conversion Rate
Applies to: everyone
Conversion rate is the percentage of visitors who complete your desired action, whatever that may be for your business. If you’re only going to track one number, this is it, though on its own it’s honestly not enough to act on.
The mistake teams make with conversion rate is treating it as one flat number across the entire site. At the very least or unless you just want to know the overall website conversion rate, it should be broken down by page, by traffic source, and by device. A 2% site-wide conversion rate might be hiding a 5% rate from organic search and a 0.3% rate from a paid campaign that’s quietly burning budget.
2. Bounce Rate
Applies to: everyone
Bounce rate tells you how many visitors leave without doing anything else on your site. A high bounce rate on a landing page sometimes means one of two things: the traffic is wrong for the offer or the page fails to make its value clear fast enough.
You should try pairing bounce rate with time on page. A high bounce rate with very short time on page suggests people leave because the page didn’t match what they expected. A high bounce rate with longer time on page might mean they read the whole thing, got their answer, and had no reason to click further, which isn’t always bad news.
3. Cart Abandonment Rate
Applies to: ecommerce
This is the percentage of shoppers who add something to their cart and then leave without buying. Industry averages sit uncomfortably high, often north of 65-70%, so if your number is in that range, don’t beat yourself up because it’s normal. But normal still leaves a lot on the table.
Common culprits: unexpected shipping costs revealed late, forced account creation, a checkout with too many steps, or a payment page that just feels sketchy. Reducing friction here (fewer form fields, visible security signals, a guest checkout option) tends to move this number faster than almost anything else on this list.
4. Trial-to-Paid Conversion Rate
Applies to: SaaS
This is the percentage of free trial or freemium users who become paying customers. This is one of the most important growth metrics for product-led SaaS companies because it tells you whether your product actually delivers on what your marketing promised.
If your trial signups are healthy but this number is low, the problem usually isn’t your pricing page, it’s onboarding. People aren’t reaching the moment where the product proves its worth before the trial ends or their interest fades.
Turn Your Data Into More Conversions
Metrics reveal where visitors drop off & a tailored CRO strategy helps you prioritize improvements that increase leads, sales, and revenue.
5. Average Order Value (AOV) / Revenue Per Visitor (RPV)
Applies to: ecommerce (with a SaaS equivalent in average revenue per user)
AOV tells you how much, on average, someone spends per transaction. RPV goes a step further and tells you how much revenue you generate per visitor overall, which accounts for both conversion rate and order value in one number.
These matter because a higher conversion rate isn’t automatically a win if it comes from discounting your way there. If your conversion rate goes up but your AOV drops enough to offset it, your RPV might actually be flat or worse. This is the check that keeps teams honest about whether a test that’s deemed successful actually grew revenue.
6. Customer Acquisition Cost (CAC)
Applies to: SaaS, and any business with a real marketing spend
CAC is what it costs you, in total marketing and sales spend, to acquire one paying customer. It’s not strictly a CRO metric in the traditional sense, but it’s the metric that gives your conversion work context. Improving your conversion rate effectively lowers your CAC, since you’re getting more customers from the same traffic and spend.
If your CRO team improves conversion rate by 20% but your CAC barely moves, something’s off in how the spend is being tracked, or the wins aren’t reaching the channels that actually cost money.
7. CTA Click-Through Rate
Applies to: everyone
This measures how many visitors click your primary call-to-action out of everyone who saw it. It’s a good early-funnel signal, useful for testing headline copy, button placement, and above-the-fold clarity before you even get to conversion.
The catch though is that a strong CTR with weak downstream conversion usually means your CTA is setting expectations your next page doesn’t deliver on. So treat CTR as a leading indicator and not a finish line.
8. Form Completion Rate
Applies to: everyone, but especially SaaS signup flows and ecommerce checkout
This is the percentage of people who start filling out a form (signup, checkout, lead gen, whatever) and actually finish it. Long forms, unnecessary fields, and unclear error messages are the usual killers of form completion rate.
A good rule to keep in mind to boost your form completion rate is to ask for the minimum information needed to get someone started. You can always collect company size, phone number, or other “nice to have” details after they’ve signed up and are already invested in the product.
9. Exit Rate at Key Funnel Steps
Applies to: everyone
Unlike bounce rate, which only measures single-page sessions, exit rate tracks where in a multi-step funnel people actually give up. That could be which page of checkout, which step of onboarding, or which point in a multi-page form.
Here, session recordings and heatmaps are necessary if you want to understand why and what’s happening better. The number tells you where people are leaving and watching a handful of those sessions tells you why.
10. Experiment Win Rate / Statistical Significance
Applies to: everyone running any kind of experimentation program
This one’s a bit different from the others because it’s a metric about your metrics. It tracks how many of your A/B tests actually produce a statistically significant, reliable result versus how many are inconclusive or false positives from stopping a test too early.
A healthy experimentation program is one where you’re confident the wins you do get are real. If your win rate is suspiciously high (say 80%+), it’s worth checking whether you’re calling tests before they’ve reached significance.
Conclusion
None of these ten metrics work in isolation, and that’s really the point. Conversion rate without AOV can hide a revenue drop. Bounce rate without time on page can mislead you about intent. CTR without form completion tells you people clicked, not that they converted.
If you’re not sure where your funnel is actually losing people, that’s usually the first thing to fix before you touch a single headline or button color. CRO tools, like CROLabs, can help here. It employs AI to audit your pages against your industry benchmarks, flags where visitors are actually dropping off, and lets you run A/B tests to validate fixes without needing a developer involved for every change.
Ready To Improve Your Conversion Rate?
FAQ
What’s the difference between a CRO metric and a general marketing metric?
A CRO metric is tied directly to whether a visitor completes a specific desired action, like a purchase or signup. General marketing metrics (impressions, reach, followers) can be useful context, but they don’t tell you whether your site or funnel is actually converting anyone.
How often should I check my CRO metrics?
Weekly for high-traffic pages, monthly at minimum for lower-traffic ones. Just be careful about reacting to short-term noise, especially on pages that don’t get enough traffic to reach statistical significance quickly.
What’s a “good” conversion rate?
It depends heavily on industry, traffic source, and what you’re asking visitors to do. Ecommerce sites often average 2-3%, while SaaS trial signups can range much higher or lower depending on how much commitment the trial requires. It’s best to ompare against your own historical baseline more than industry benchmarks.
Do I need every metric on this list?
No. Pick your 3-4 primary metrics based on your business model, plus a couple of supporting ones that explain movement in those primaries. Tracking all ten in detail every week is a good way to drown in dashboards instead of making decisions.
How does a CRO audit fit into all this?
A CRO audit is essentially a structured way of reviewing these metrics together to find where your funnel is leaking. Rather than guessing where to optimize first, an audit shows you the highest-friction points based on actual data, so your first experiments are the ones most likely to move the needle.