Updated Oct 2026
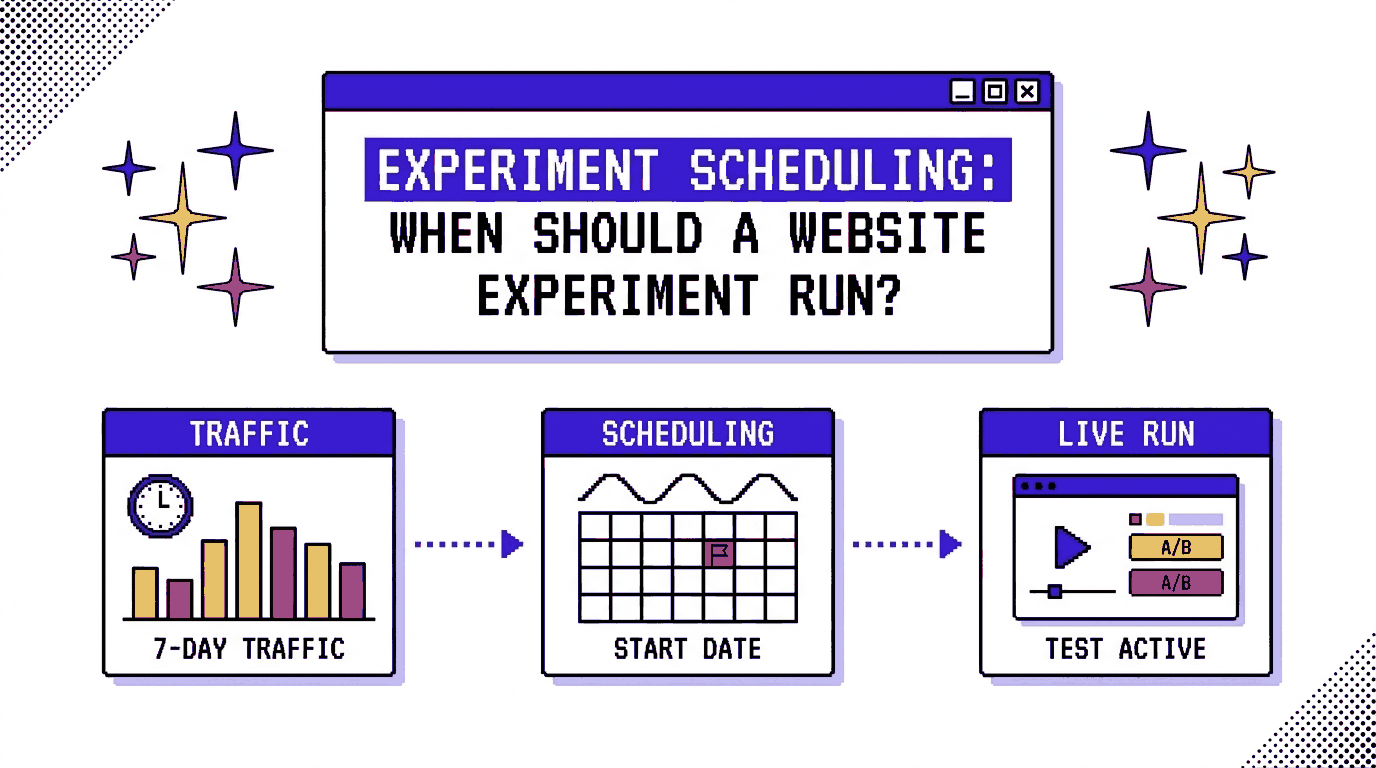
A website never closes, and its visitors still behave as though it keeps hours. Conversion rates rise and fall with the day of the week, the date in the month and the season of the year, which means an experiment records the calendar along with the change you made to the page.
That makes the question of when a test runs worth asking before you decide what it tests. In this article, we cover the standard duration for an A/B test, go through the calendar factors that can bend your results, and finish with a way to decide whether an experiment should be paused, scheduled or left running continuously. Along the way, we also show how scheduling works in CROLabs.
On This Page
Should Your A/B Test Run 24/7?
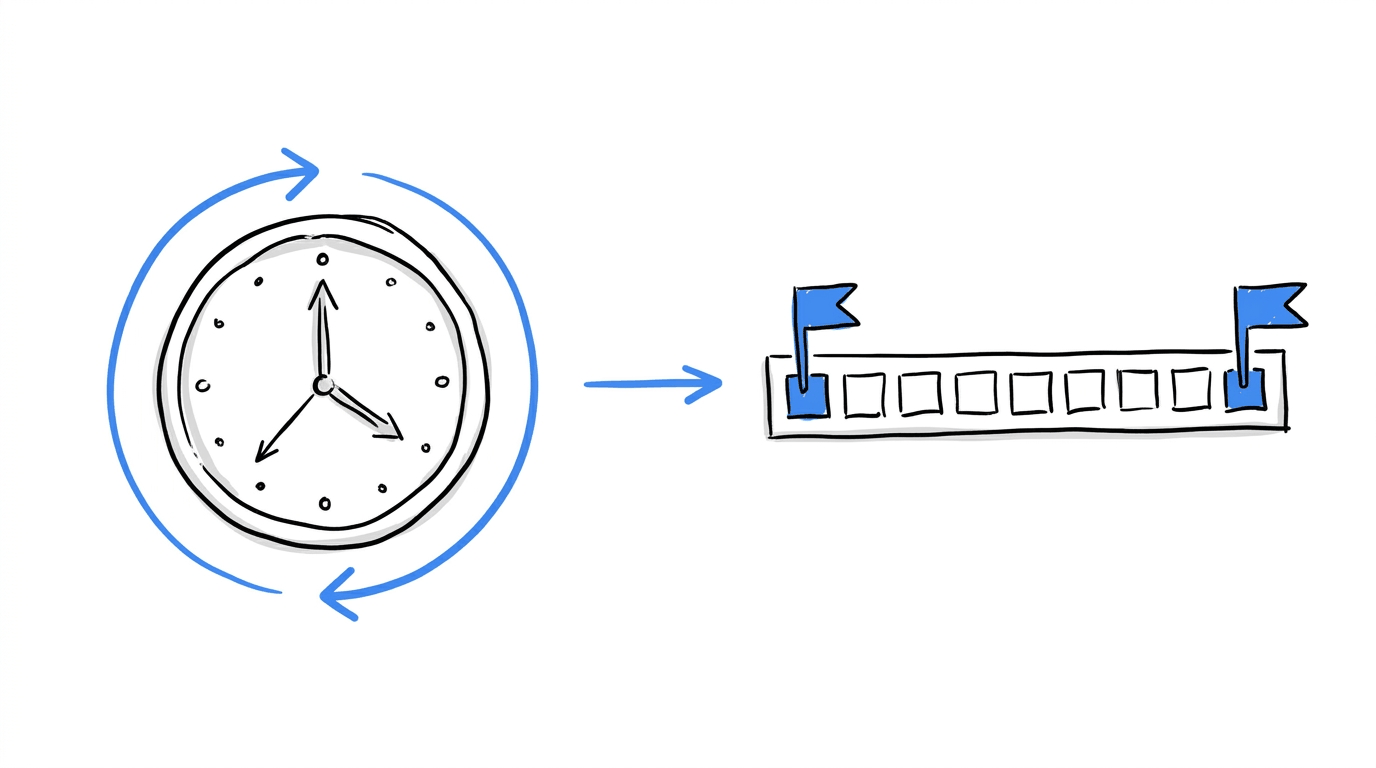
Alright, let’s answer the headline question first. The answer has two parts, because “24/7” can describe two different things.
Within a single run, yes. Traffic should be split every hour of every day for as long as the test is live. A test that only shows during office hours leaves out the visitors who browse at night and on their commute, and those visitors often convert differently from the daytime crowd.
Across the calendar, no. A test should have a start date and an end date that you chose in advance. An experiment with no end date collects whatever the calendar delivers, whether that is a public holiday, a flash sale or the last week of a campaign.
So the useful question is “which dates should this experiment cover?” The rest of this article helps you answer it.
How Long Should An A/B Test Run?
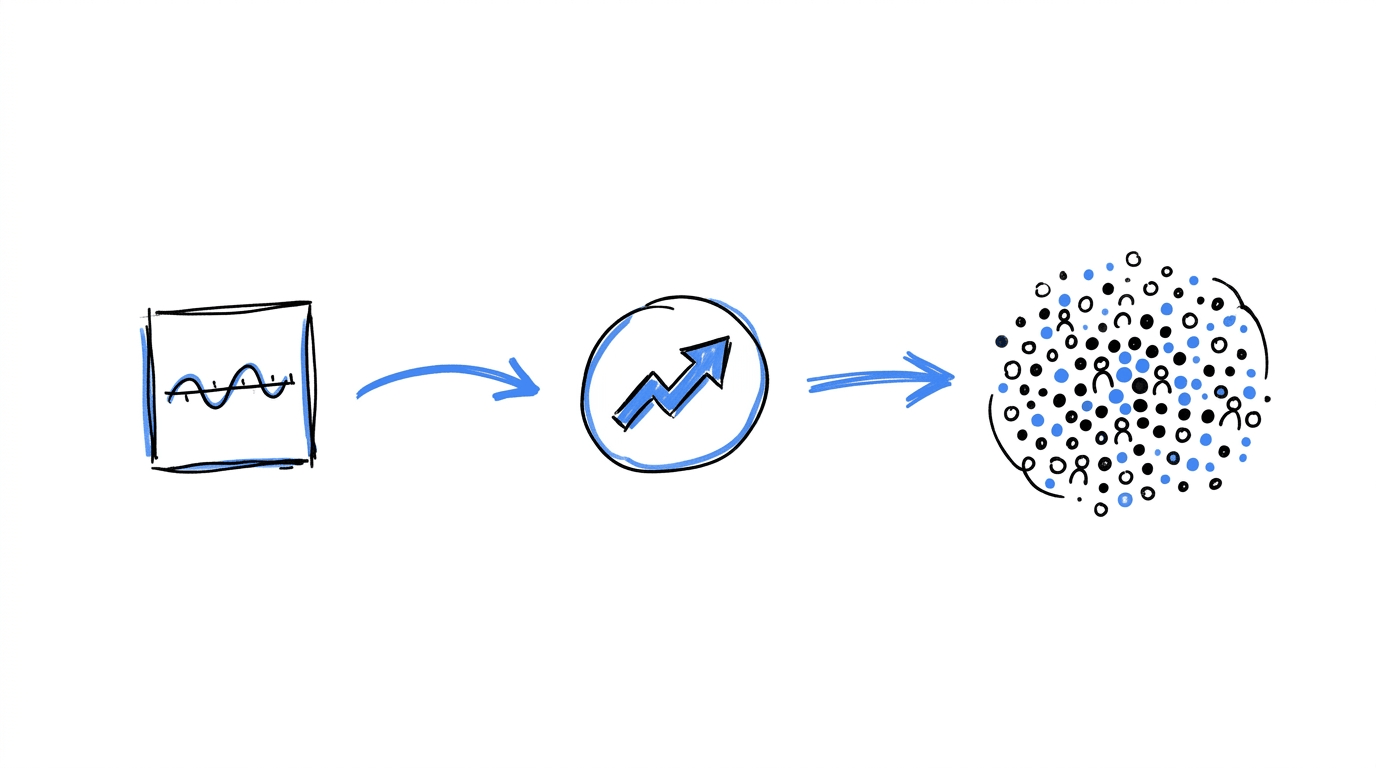
Before any calendar factor comes into play, a test needs enough visitors to detect the change you care about. That number comes from four inputs, as this duration guide lists them: your baseline conversion rate, the minimum detectable effect (MDE), your significance level (conventionally 95%) and your statistical power (conventionally 80%).
For baseline conversion rate and MDE, we’ll need a plain definition.
- Baseline conversion rate: what the page converts at today.
- Minimum detectable effect (MDE): the smallest lift you want the test to reliably pick up.
Once you have the sample size per variation, the run time is that number multiplied by the count of variations and divided by the daily visitors entering the test.
How MDE changes the run time
A smaller lift needs far more visitors to confirm. Shopify’s guide to A/B testing gives two figures for a page with a 5% baseline. We added the last column ourselves, assuming a page that sends 1,000 visitors a day into a two-variation test.
| Lift you want to detect | Visitors needed per variation | Approximate run time at 1,000 visitors a day |
|---|---|---|
| 15% | 13,533 | 27 days |
| 8% | 47,127 | 94 days |
Traffic volume moves the same lever. The Optibase duration calculator shows a test needing 28,000 total visitors taking 56 days at 500 visitors a day and 28 days at 1,000.
The calendar floor
Reaching the sample size does not end the calculation. Atticus Li’s duration guide recommends at least two full weeks even when the sample size could be reached in five days, and notes that businesses with monthly patterns, such as pay-cycle effects, may need a full month. Email tests sit at the short end of the range. Spotler puts the usual window at one to two weeks for email campaigns and two to four weeks for website tests.
Here is the practical version:
- Calculate the sample size from your baseline, MDE, significance level and power.
- Divide by your daily traffic to get the raw number of days.
- Round up to whole weeks, so every weekday appears the same number of times in both variations.
- Raise the floor to two weeks, or to a full month if your sales follow a monthly pattern.
Once the end date is set, leave it alone. Checking results repeatedly and stopping at the first good-looking reading can push a nominal 5% false positive rate as high as 30%, and our guide to when to stop your experiment early covers the short list of situations that do justify an early exit.
Now, when should you schedule your experiments? Let’s look at that.
Plan your next experiment with CROLabs
Once you’ve calculated the sample size and chosen a realistic test duration, you need a way to build and run the experiment itself.
1. Weekly Traffic Cycle
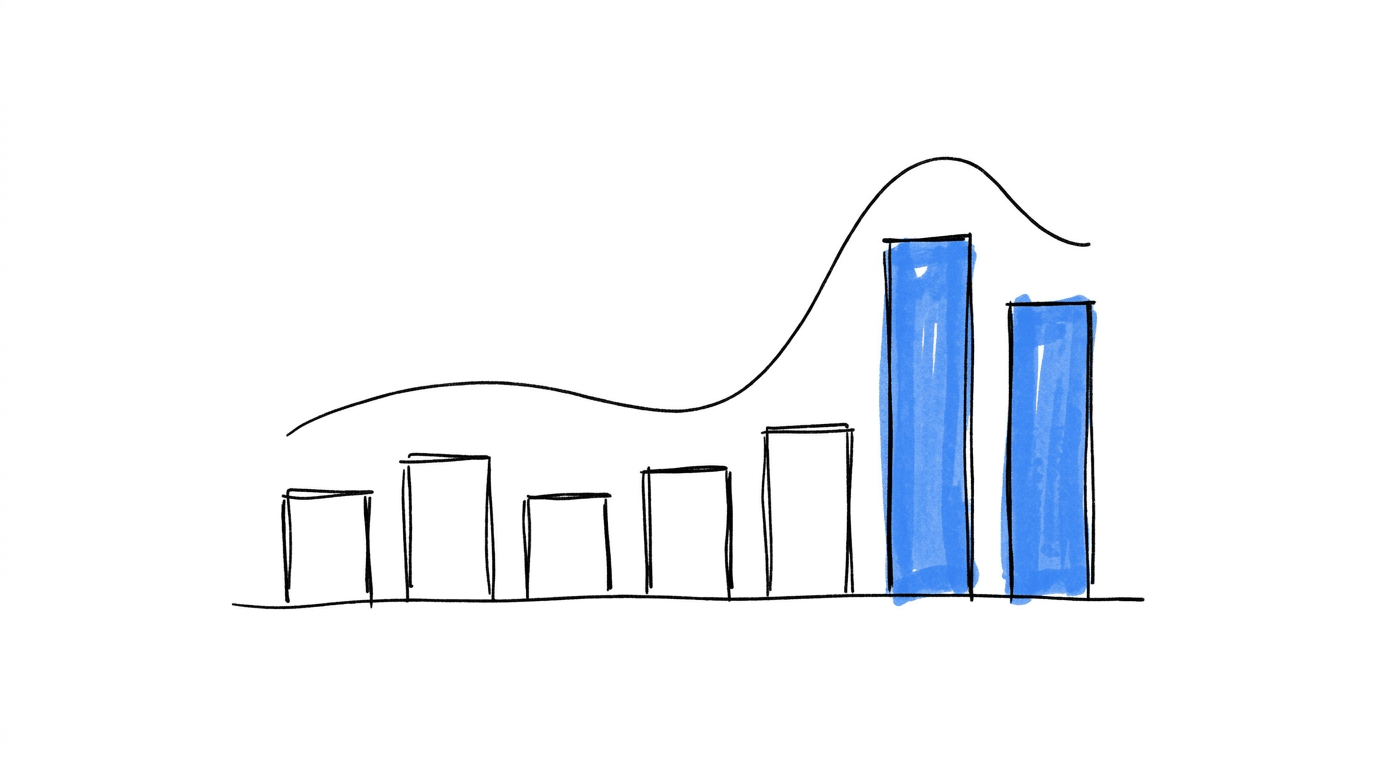
Visitors on Monday morning and visitors on Saturday night share a website and little else. Whole weeks are the cheapest way to keep both groups in your sample.
a. Weekday vs Weekend Traffic
Weekly rhythm is the first calendar effect to check, and it differs from site to site. The research points in more than one direction:
An eight-month study of online shoppers found more purchases early in the week and fewer on weekends.
Gallup’s consumer spending data showed that average daily spending on weekends exceeded weekday spending in the US.
Across Shopify stores in a dataset of more than 10,000 tests, Tuesday was the highest-traffic day, so a Monday launch caught a full Tuesday peak.
B2B sites often see traffic fall on weekends, which Georgi Georgiev describes as weekly seasonality.
These findings come from different audiences, so none of them tells you what your own visitors do. Your analytics and heatmaps will show it within minutes. If your weekdays and weekends look alike, a one-week cycle works. If they differ sharply, the two-week floor matters more, since each weekday then appears twice in your data.
A scheduling habit follows from this: start and end every test on the same weekday. A test that begins on a Monday and ends on a Thursday two weeks later counts Monday through Thursday three times and the weekend twice.
b. Recurring Traffic Patterns
Weekdays aren’t the only repeating thing. Your site has other rhythms that a full week or two will catch:
- a newsletter that goes out every Tuesday morning
- a weekly webinar that sends a burst of sign-ups on Thursday
- lunch-hour and late-evening mobile peaks
- a monthly invoice reminder that pulls existing customers back to the billing page
The first days of any test also carry a novelty effect, where returning visitors react to a change because it’s new. Two full cycles give that reaction time to fade, so the second week tells you more than the first.
2. Payday Effects And Monthly Rhythms
Money arrives on a schedule, and visitors spend on one. Gallup found a “paycheck effect,” with daily spending higher in weeks that contain a typical payday, around the start and middle of each month. A Lazada survey of 345 shoppers in the Philippines found that 47.4% spend more on a payday meal, and that bills weigh on nearly 74% of them around the 15th and 30th. In the UK, ecommerce agency QueryClick tied a dip and rebound in conversion during March 2026 partly to payday timing, with conversion recovering once salaries landed.
The evidence has limits. The eight-month shopper study mentioned earlier compared the first and last Mondays of each month and did not find a consistent first-of-the-month spike. So the payday effect is strong in some markets and weak in others, and your own data decides which kind of site you run.
Payday can also change which message works. Research from the University of Utah, reported by RBR, found that shoppers with fresh cash lean toward purchases that improve their lives, while shoppers further from payday lean toward purchases that protect what they have. A headline test run only in the week after payday can favor the aspirational variation, and the same test two weeks later can favor the cautious one.
What to do with this:
- Monthly-cycle sites: run the test across a full month, or schedule two runs that each start on the same day relative to payday.
- Short tests: avoid ending one on the 14th or 29th while the next one starts after payday, because the second test then sees richer traffic than the first.
- Cart and checkout tests: these react to payday more than most, so compare them only against periods with the same position in the pay cycle.
3. Calendar Events That Change Who Visits
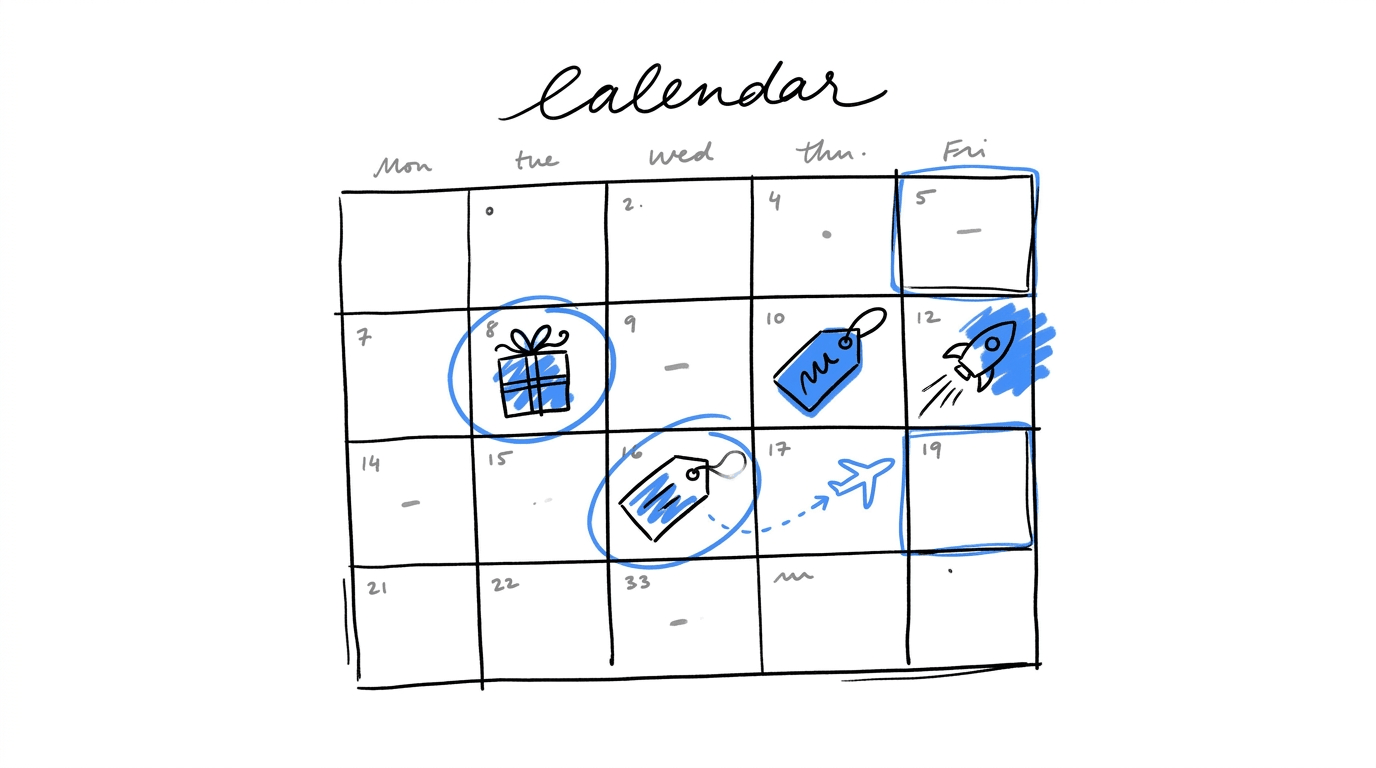
Some events change the audience as well as the volume. When the mix of visitors shifts, the same variation can win in one week and lose in the next.
a. Seasonal campaigns and holidays
Seasonality is any cyclical movement in your numbers, daily, weekly, monthly or yearly. A test that wins during Black Friday may lose during a slow February, and if you must test during a seasonal peak, Atticus Li advises re-running the test in a neutral period before making the change permanent. Split’s experimentation team suggests a similar discipline for extreme seasons: run complete weeks, and avoid drawing general conclusions from a result gathered during Black Friday week.
Holiday audiences are also built differently. GemPages notes that holiday campaigns rarely rely on one acquisition channel, which makes the audience more diverse than usual, and that convenience, urgency and promotions become stronger purchase drivers. Their example of swapping “Learn More” for “Shop Holiday Deals” shows a change that makes sense only inside the season.
That does not mean you should stop testing in November. Test things that belong to the season, such as delivery deadline messaging, and label the result as a holiday result. Marketing science firm Recast puts the underlying issue this way: results from experiments are time-bounded, so a summer result may not apply to the holidays and the reverse also holds.
b. Promotions
A sale changes who arrives, how motivated they are and what they expect to pay. If a test catches a discount week in its first seven days, the conversion rate during that week says little about a normal week. Spotler’s guidance is that results transfer best when the test ran under normal conditions, with no unusual promotions or seasonal spikes.
Two workable approaches exist. You can keep promotional weeks out of the test window altogether, or you can design the test for the promotion, so the whole run sits inside the sale and the result describes sale behavior only.
c. Product launches
A launch brings a surge of new visitors who have never seen your page, and it adds the novelty effect on top. Atticus Li describes novelty as users engaging with a change because it is new, with the effect fading as they get used to it. A test that covers only launch week can crown a variation whose advantage disappears by week four.
If the test runs through a launch, compare new visitors with returning ones. A lift concentrated among new visitors points to novelty. A lift that holds among returning visitors is more likely durable.
d. Campaign flight dates
A campaign flight is the period during which an ad runs. When you test a page built for that campaign, the test and the flight should share dates. Visitors arriving after the flight ends come from different sources and expect different things, so they dilute the result.
Set the experiment’s start a day or two after the ads go live, which gives traffic time to settle, and end it on the last day of the flight. Ad-to-page personalization in CROLabs pairs a page with the ad that sends the visitor, which makes flight-based scheduling a natural fit.
e. Payday Effects
Money arriving changes what people buy. The Gallup study above found higher spending in weeks that contain the start and middle of the month, and an InMarket report measured a 33% jump on payday itself that stayed elevated for a few days. The earlier online-shopper analysis found no consistent first-of-the-month effect in its own data, which makes your analytics the final word.
If your product sells on monthly billing or serves salaried buyers, run through at least one full pay cycle. A school-fees payment portal is a good case, since its busiest days follow salary dates and term openings.
Turn your traffic calendar into a testing plan
You’ve mapped out your traffic patterns, flagged important dates and identified a suitable testing window. Now put that plan into practice with CROLabs. Schedule your experiments around campaign dates and recurring traffic patterns, and keep your testing program organized around the windows you’ve chosen.
Build A Traffic Calendar Before You Open The Scheduler
Every effect above shows up in your own data before it shows up in a test result. A traffic calendar puts them side by side, and building one takes an afternoon.
- Pull a year of daily data. Export visits and conversions per day for the page you plan to test.
- Mark the known events. Add paydays, public holidays, promotions, launches and campaign flights as labels on the timeline.
- Look for repeating shapes. Find the weekly pattern first, then the monthly one, then the seasonal one.
- Run an A/A test for a week. Split recommends an A/A test to collect fresh metric baselines, with a full week so every day of the week is sampled. Both groups see the same page, so any difference between them shows the natural noise in your data.
- Pick a window with no conflicting events. Choose a start day, calculate the end date in whole weeks and check the window against the calendar.
- Share the calendar. Marketing, merchandising and product teams can then see which weeks are reserved for experiments and avoid launching changes into them.
The calendar also records which weeks carried unusual conditions, so when a result looks odd months later, you can look up the week it came from.
Pause, Schedule Or Run Continuously?
Each mode fits a different situation, and many programs use all three.
| Mode | Fits when | Watch out for |
|---|---|---|
| Schedule | The test has a defined sample size, a campaign flight or a calendar event to avoid or include | A window that ends mid-week or splits a pay cycle |
| Pause | Something outside the test disrupts it temporarily, such as a tracking fault or an out-of-stock product | Gaps in the data that leave some weekdays under-represented |
| Run continuously | The experiment is a long-term holdout, a validation of a past winner, or an always-on personalization rule | Results drifting as the audience and season change |
When scheduling is the better choice
Most A/B tests belong here. You know the sample size, you know the calendar, and a start and end date written before launch removes the temptation to stop on a good day.
When pausing makes sense
Pausing suits a disruption that will pass. After a pause, extend the test so the run still ends on a complete week, and exclude the affected days from the analysis when a fault caused them. A run broken by several pauses becomes hard to trust, and a clean restart as a new run sometimes serves you better.
When continuous running is useful
A holdout group compared against a shipped winner shows whether the effect lasts. Atticus Li points out that if the gap between holdout and implementation narrows over time, the effect is fading, possibly because novelty is wearing off. Continuous runs work best with a review date on the calendar, so someone looks at the numbers on a set day.
Scheduling Experiments In CROLabs
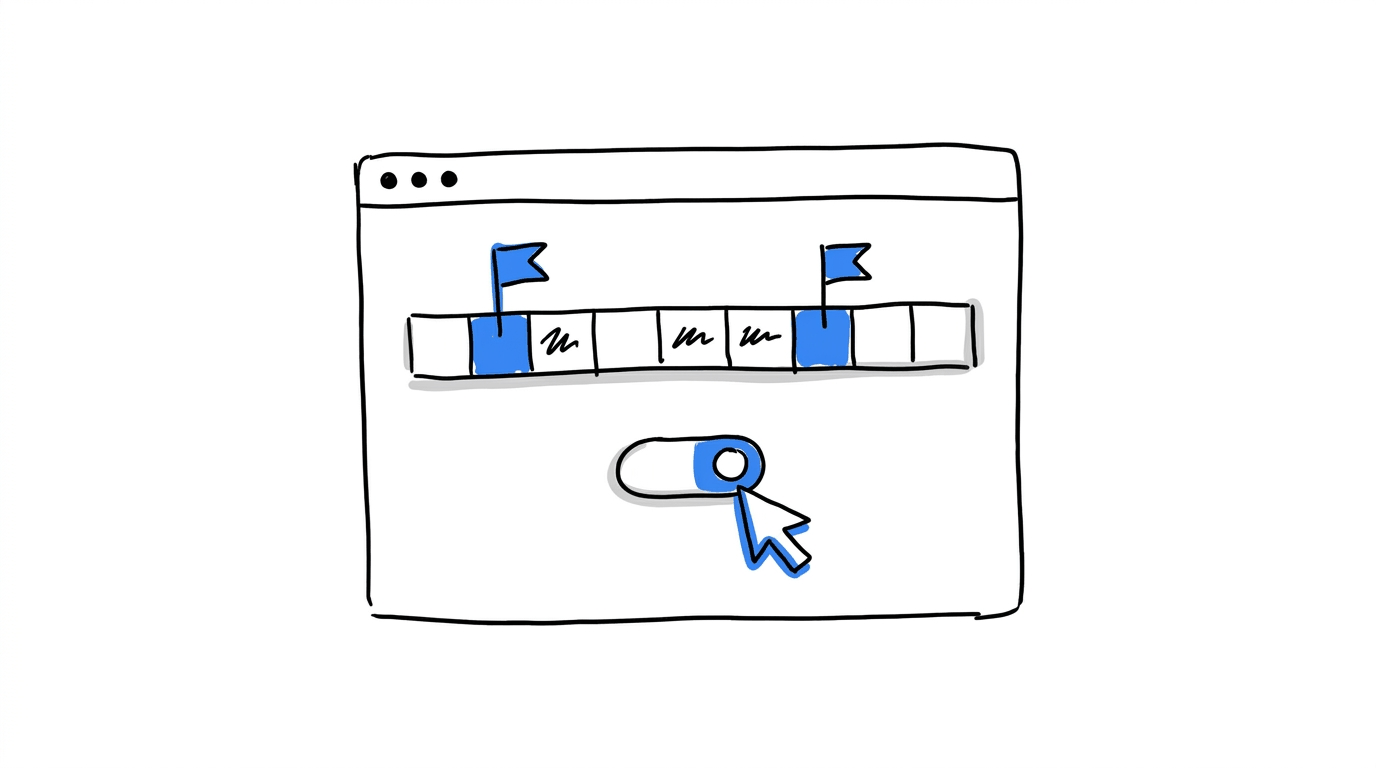
CROLabs lets you schedule experiments, so the dates you chose in your traffic calendar become the dates the experiment follows. A practical setup looks like this:
Set the start date for a Monday, or for the first day of the campaign flight.
Set the end date after a whole number of weeks, and match it to the last day of any ad flight feeding the test.
Add an auto-stop condition for the events you can name in advance, so the platform enforces your rules on weekends.
Confirm your conversion tracking and run through the experiment QA checklist before the start date arrives, because a scheduled test launches whether or not anyone is watching.
Teams that want a place to begin can run their first scheduled test with CROLabs’ A/B testing feature, and the 14-day free trial covers setup through results.
Conclusion
An A/B test should stay live around the clock while it runs, and its run should be bounded by dates you set before launch. The duration comes from your sample size, rounded up to whole weeks, with a floor of two weeks and a full month for sites with monthly buying patterns. Weekday rhythm, payday, seasons, holidays, promotions, launches and campaign flights each change who visits and how they behave, so a test window that ignores them records the calendar along with the change you made.
Build a traffic calendar, pick a window that fits it, and decide in advance whether the test should be scheduled, paused or run continuously. Then set those dates in CROLabs and let the experiment follow them.
Ready to schedule your next A/B test?
Put your testing calendar to work with CROLabs. Set your experiment dates, configure your stopping conditions and check your conversion tracking before launch. You can start free and use the 14-day trial to get your first experiment up and running.
FAQs
Should an A/B test run 24/7?
Within its run, yes. Traffic should split every hour of every day so night and weekend visitors are included. Across the calendar, a test needs a fixed start and end date chosen before launch, so it covers a planned window and stops once it has enough data.
What is the standard duration for an A/B test?
Calculate the sample size from your baseline conversion rate, minimum detectable effect, 95% significance and 80% power. Divide it by your daily traffic, then round up to whole weeks. Most website tests land between two and four weeks, and Atticus Li’s guidance sets a two-week minimum even when the sample arrives sooner.
Should I run an A/B test during Black Friday or the holidays?
You can, with a clear label on the result. Test seasonal items such as delivery deadlines and holiday messaging, and avoid applying the winner to the rest of the year without a re-test in a neutral period.
Does payday affect A/B test results?
It can. Gallup’s data shows higher spending in payday weeks, although another study found no consistent first-of-the-month spike. Check your own daily conversion data, and run the test across a full month if the pattern shows up.
Is it better to start a test on a Monday?
Starting on any fixed weekday and ending on the same weekday gives every day of the week equal weight. Monday suits many sites, and in one Shopify dataset it let tests capture a full Tuesday peak. Your own weekly pattern should decide the day.
Should I pause a test if a promotion starts mid-run?
Check whether the promotion changes your traffic mix. If it does, pause for the promotion and extend the run to finish on a complete week, or restart as a new run. If the promotion was part of the plan from the start, keep the test live and label the result as a promotion result.
Can I test continuously after a winner ships?
Yes. Keep a small holdout group on the old version and compare it with the winner at a scheduled review date. If the gap narrows over time, the original lift was partly novelty.