Updated Oct 2026
In September 2000, Amazon ran a five-day pricing experiment on 68 DVD titles. One of them was The X-Files: The Complete Second Season, which appeared on the site at prices ranging from $89.99 to $104.99, despite having a list price of $149.98. When customers discovered they were seeing different prices for the same product, the backlash followed. Amazon refunded 6,896 customers an average of $3.10 each, according to the company’s statement and contemporary reporting by E-Commerce Times.
The incident raises a question you should consider before running any pricing experiment: how much room do you have to experiment with what customers pay?
Pricing tests can involve something as small as changing the order of subscription plans or making an annual billing option more prominent. They can also involve charging different customers different amounts for the same product. The first approach examines how people respond to a pricing page, while the second changes the price they encounter. Each requires a different testing approach, and the risks vary considerably.
For businesses considering a pricing experiment, the distinction matters from the start. You can learn a great deal by testing how you present your prices, including how customers perceive your plans and which options they choose. Testing the prices themselves requires more care because the results can affect revenue, customer trust and future purchasing decisions.
This article looks at the pricing page elements worth testing, from plan order and billing options to discount messaging, trial terms and comparison tables. It also covers how to approach experiments that change the price itself, so you can decide which type of test makes sense for your business.
On This Page
What Counts as a Pricing Test?
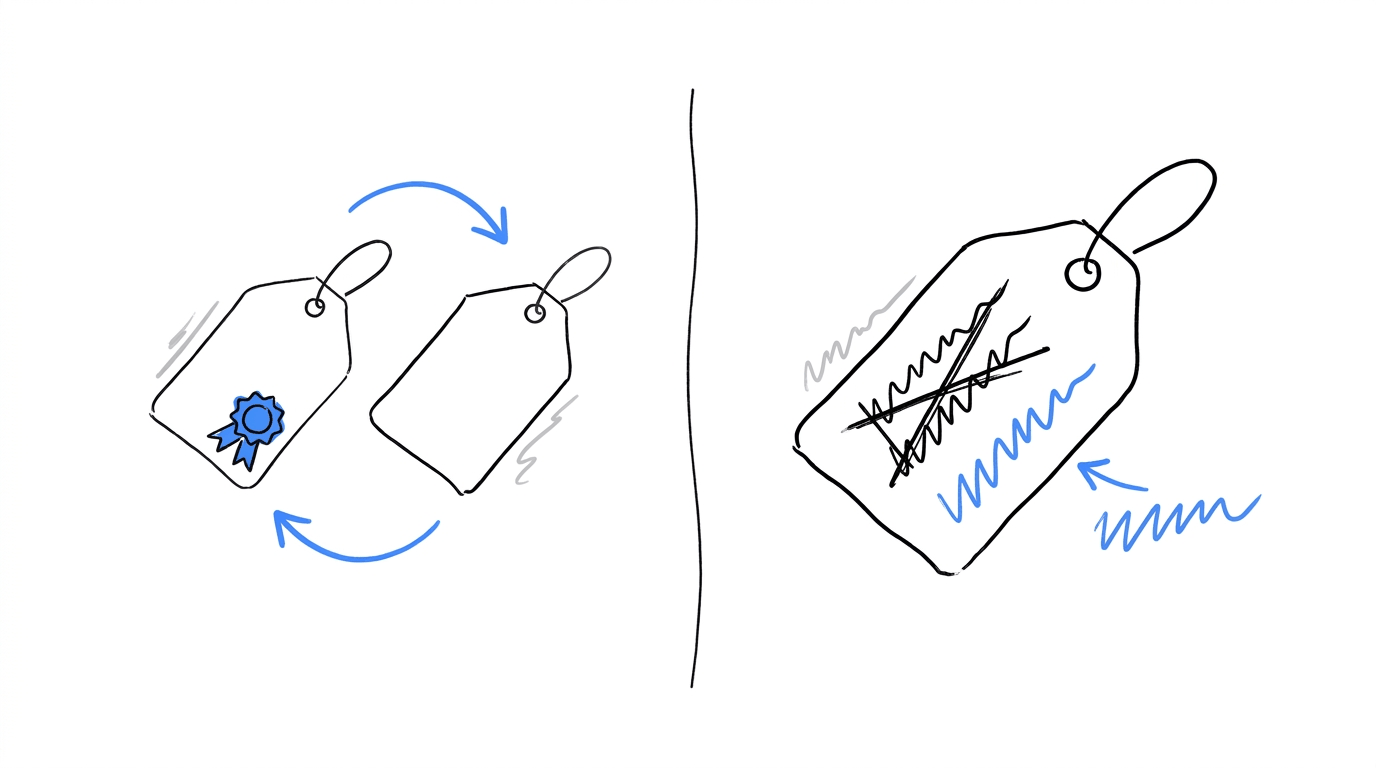
Pricing-page CRO focuses on how visitors encounter the prices on your website. Pricing strategy deals with the decisions behind those prices, including how much you charge, how you group features into plans and which pricing model you choose. Since both affect the same page, it can be difficult to tell which one caused a change in customer behaviour.
| Pricing-page CRO | Pricing strategy | |
|---|---|---|
| Question it answers | Which layout helps visitors pick a plan? | What should this plan cost? |
| What changes | Order, labels, badges, toggles, tables | Amount, tiers, billing model, discount depth |
| Does anyone pay a different amount? | No | Yes |
| Typical metrics | Plan clicks, signups, plan mix | Revenue per visitor, churn, lifetime value |
| Main risk | A lift that fades after signup | Customers comparing notes and finding different prices |
The easiest way to separate the two is to look at what happens to the amount a customer pays. If every visitor sees a different version of the page but pays the same price, you’re testing the presentation. Any change in results can help you understand how the layout or wording influences purchasing decisions. If the experiment changes the amount charged, you’re testing the price itself and learning about customers’ willingness to pay.
This distinction also determines how carefully you need to approach the experiment. Whenever visitors could pay different amounts for the same offering depending on which version they see, fairness becomes a concern. The sections below explain the risks involved and the methods you can use to test prices more safely.
Test your pricing page without changing your prices
Find out how visitors respond to different plan layouts, billing options and pricing messages. With CROLabs, you can build page variants visually and run A/B tests while keeping the prices consistent across visitors.
Anchoring, Plan Order and Comparison Tables
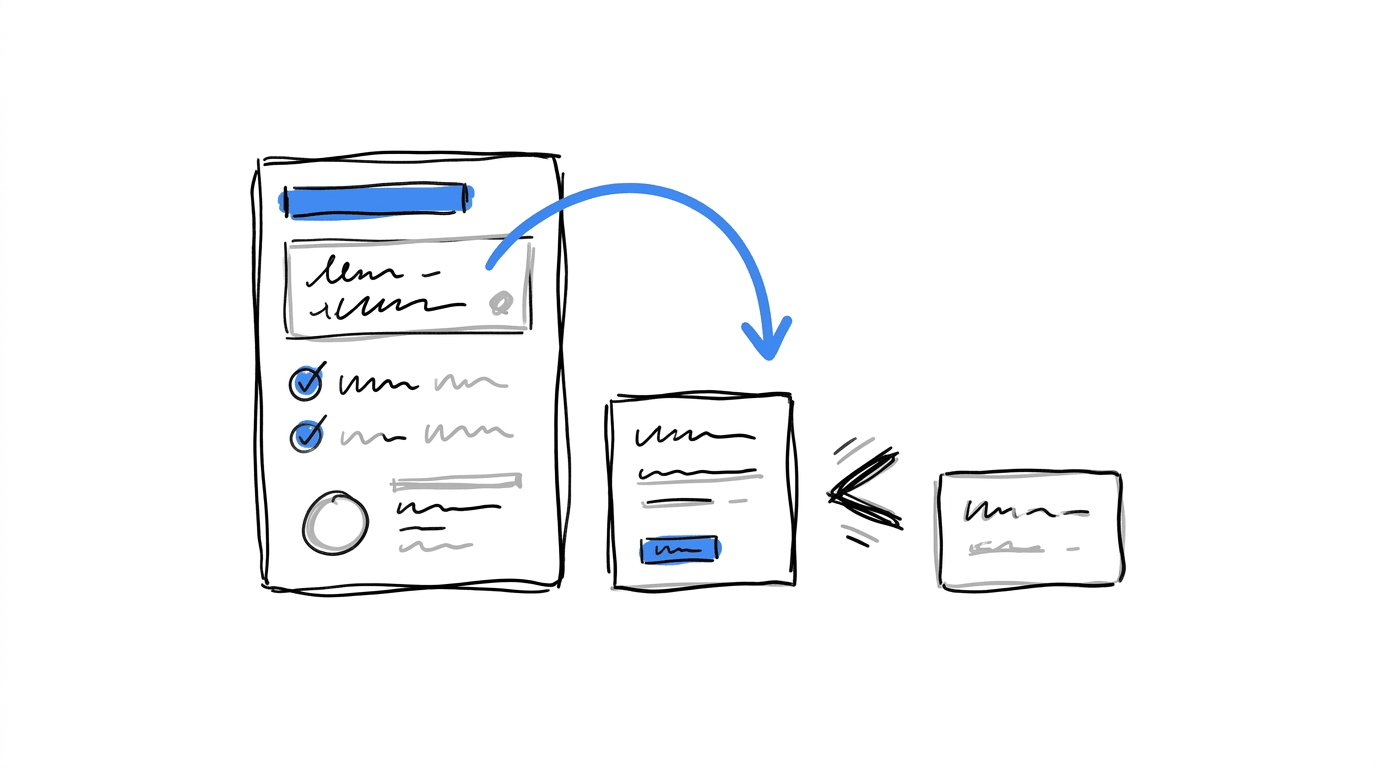
Most pricing page tests that people run first deal with how plans sit next to each other. Each one leaves the price list as it is and changes what a visitor compares it against.
Price anchoring and plan order
The order of your pricing plans can change how visitors judge what each one costs. This is known as price anchoring, and it simply means that the first number a visitor sees becomes the reference point for every number after it.
When someone sees a $299 plan first, the $99 option beside it may feel more affordable by comparison. Put the $99 plan at the beginning, though, and visitors have a different starting point for evaluating the available options. Essentially, price anchoring can influence which plan people consider worth buying.
There are examples of businesses testing this on their pricing pages. The GoodUI archive documents experiments on Kenhub.com and Uptowork.com that moved the most expensive plan to the first position. Backstage.com tried a different approach by reducing three plans to a single recommended annual option, with a smaller link for visitors who preferred monthly billing. That experiment changed both the number of plans displayed and the default billing period, making it harder to isolate which change influenced the outcome (GoodUI pricing tests).
The archive doesn’t publicly disclose the exact effect sizes for these experiments without a membership, so use them as inspiration for tests you could run on your own site. Your visitors may respond differently depending on their budgets, expectations and familiarity with your product. If you decide to change your plan order, keep the other elements consistent so you can see whether the new arrangement influences which option people choose.
Comparison tables
A comparison table puts plans in rows and features in columns so visitors can check one against another without scrolling between cards. GoodUI lists a test on Prepagent.com that applied this pattern to a pricing page (see the entry). The decisions worth testing are:
- Whether the table sits below the plan cards or replaces them
- How many feature rows appear before a “show all” control
- Whether the recommended plan’s column is highlighted
- Whether rows that every plan shares are left out
Feature framing
Feature lists come in two common formats, a full checklist and a short set of outcome-based bullets. Mida’s guide to testing pricing pages suggests comparing them directly, and the test is cheap to build because the plans and prices stay put.
Billing Toggles, Discounts and Free Trials
These three elements decide how a price is split across time, and they influence plan mix more than most layout changes do.
Monthly vs. annual presentation
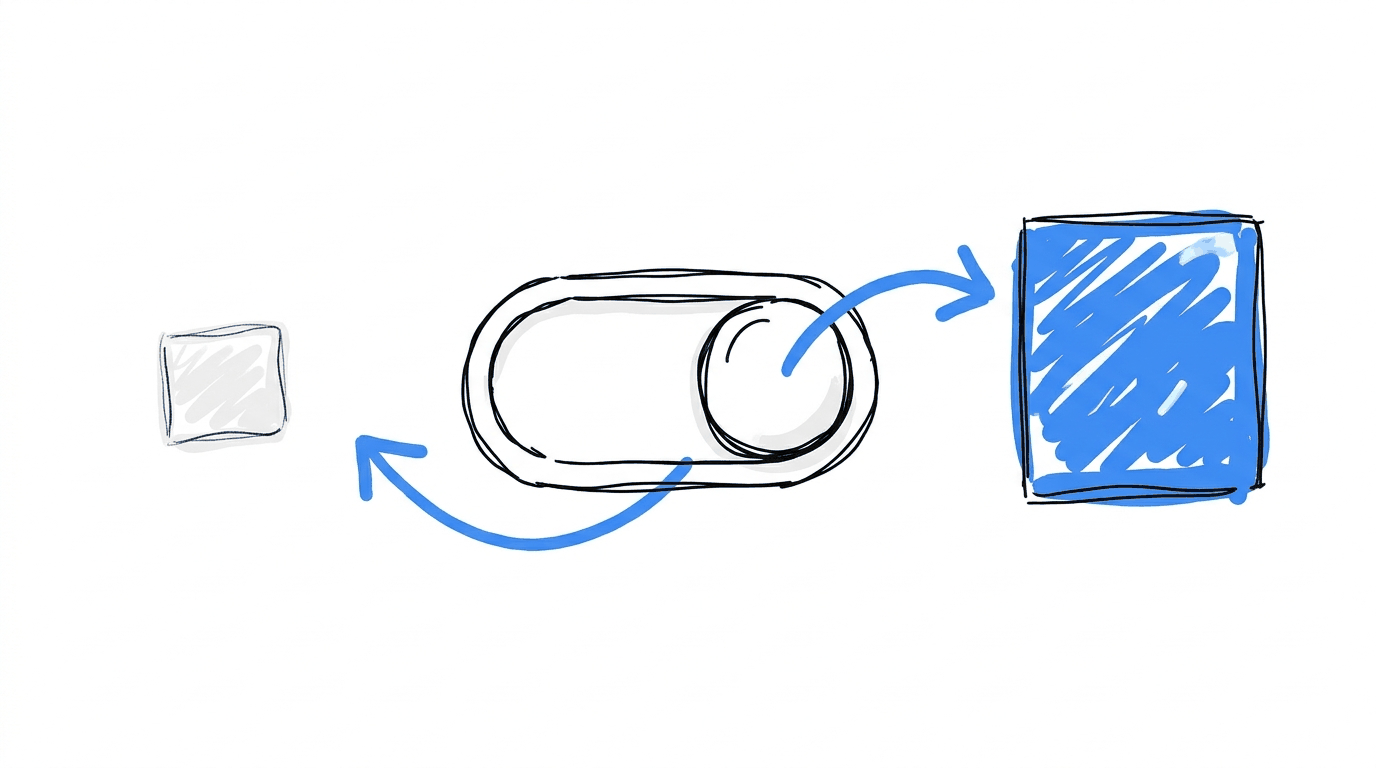
The toggle looks like a small interface detail, yet its default state moves revenue in two directions at once. A pricing page benchmark from Visionary Marketing, built on its own archive of 4,200 tests, reports the following outcomes (source):
| Setup | Annual signups | Total conversion |
|---|---|---|
| Toggle defaulting to monthly | Baseline | Baseline |
| Toggle defaulting to annual | +27% | -6% |
| Annual only, no toggle | +34% | -11% |
| Annual shown, small “or pay monthly” link | +24% | +7% |
This is a vendor’s own dataset, so use it to decide what to test and check the direction against your traffic before you adopt any of it.
The annual default has a second cost that conversion rate won’t show. Chargebee describes a visitor who sees a low monthly equivalent, switches to monthly billing and meets a jump to $29. It also quotes a practitioner who has seen tools charging $12 on annual and $36 on monthly, a gap wide enough that the monthly price reads as a penalty. Measuring the size of that gap belongs in the test plan.
Discount presentation
A saving of the same size can be written several ways. Mida lists “Save 20%,” “Get 2 months free” and a plain dollar amount as variants worth comparing. Its test write-up for Grok’s plans page sets a “save $60/year” badge on the annual plan against a version without one.
Per-month framing is another variant. GoodUI records a test where a $69 payment was explained as $6 a month over one year, next to $89 explained as $4 a month over two years (GoodUI). Each phrasing sets a different reference point in the visitor’s head, so each one deserves its own variant.
Free-trial framing
Trial framing covers the button label, the trial length printed on the plan card and whether a card is requested at signup. All three alter who starts a trial, so the number to watch is the share of trials that become paid accounts, with raw trial starts as a secondary signal. A variant that doubles trial starts and halves conversions to paid has moved signups around without adding revenue.
Find out which pricing options drive paid conversions
Changing your annual billing default or discount messaging can affect both signups and the plans visitors choose. Use CROLabs to test different versions of your pricing page and track how those changes affect conversions.
Price Visibility: Show It, Hide It or Gate It
Price visibility sounds like a strategy call, but a lot of it is testable on the page. Four setups come up in practice:
- Full prices shown for every plan
- A “starting at” figure on the lowest plan, with a conversation required for the rest
- Prices visible only after a visitor enters an email address
- No prices, with a “talk to sales” button
The metric changes from one setup to the next. Visible prices send fewer but better-informed people to a sales call, and hidden prices send more people to a form, so counting form submissions would make the second setup win by default. Count qualified conversations and closed revenue instead, and give the test enough weeks for sales cycles to show up in the data. Teams running paid traffic to a B2B SaaS pricing page tend to feel this first, since every click costs money.
When the Number Itself Is the Variable
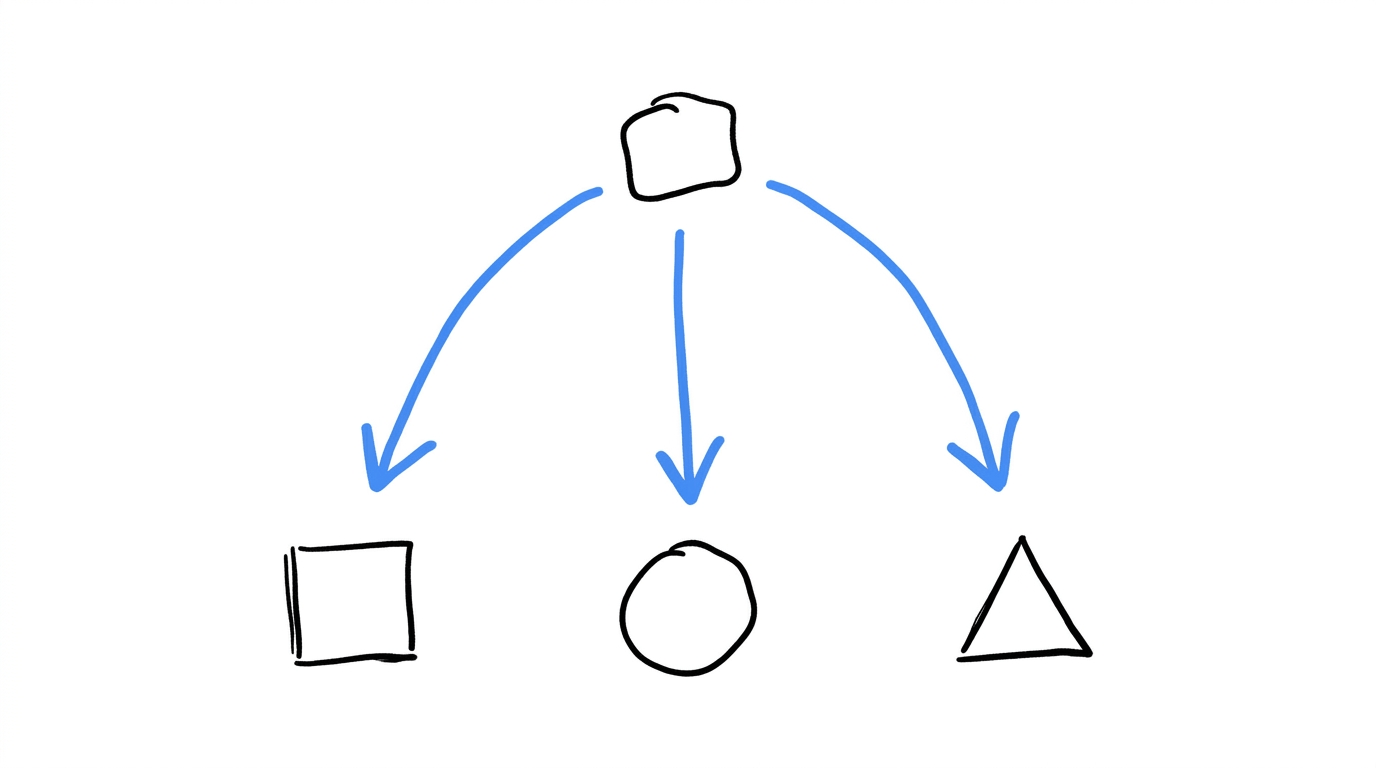
Testing the amount charged is a legitimate practice, and it needs more care than anything above. Amazon’s 2000 experiment is the standard cautionary tale. The test varied prices on 68 DVDs with discounts between 20% and 40% (E-Commerce Times), and Jeff Bezos later said even a random test was a mistake because it created uncertainty for customers (CNN Money). One academic summary of the episode observes that the shoppers objected less to higher prices than to the sense that personal shopping history was being used against them (ProQuest abstract).
The fairness question
Visitors compare notes in forums, group chats and review sites. A price test therefore has to survive the moment two people find out they paid different amounts, and that moment arrives sooner than a test’s planned duration. Amazon’s own remedy gives a template: if it ever tested again, it said, buyers of a test item would automatically receive the lowest test price.
Safer ways to test price
- New plans. Launch a new tier to a slice of visitors, since nobody has a previous price to compare it to.
- New visitors only. Keep existing customers on their current price and run the test on first-time traffic.
- Separate markets. Different countries and currencies already carry different prices, which makes cross-market comparison natural.
- Rollout controls. Feature flags let you release a new price to a small share of traffic and pull it back fast.
- Conversations. Customer interviews and survey questions about expected price ranges cost nothing in customer trust.
Sales and legal teams should review any plan that charges visitors different amounts, because consumer protection rules differ by country.
What to Measure Once the Price Is on Screen
Signup rate is the metric that moves first, and it has the weakest link to revenue. A fuller scoreboard for a pricing test includes:
- Conversion to paid: the share of visitors who finish checkout or become paying accounts
- Revenue per visitor: conversion multiplied by the average amount paid, which settles disputes between variants that win on different metrics
- Plan mix: how visitors spread across tiers
- Annual share: the portion of buyers choosing yearly billing
- Refunds and early churn: read at 30, 60 and 90 days after the test, since a presentation that over-sells shows up here
Two habits keep the results trustworthy. The first is a pre-launch review, and the experiment QA checklist covers what to confirm before traffic starts. The second is patience, because stopping a test too early is the usual way a pricing page ends up with a false winner.
Running Pricing Page Tests in CROLabs
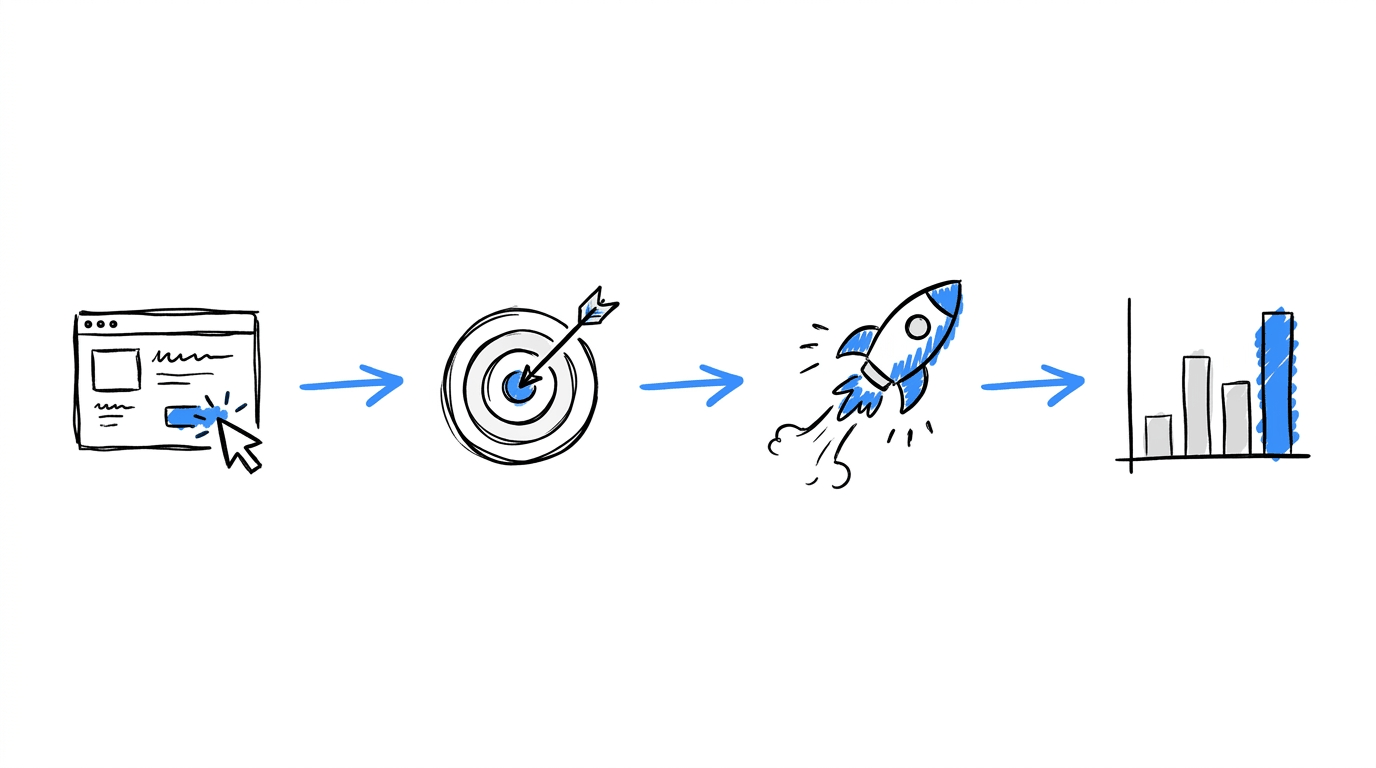
Presentation tests suit a visual workflow because the prices stay the same and only the page changes. Here is how the setup looks in CROLabs:
- Open the pricing page in the visual editor and build the variant, such as a reordered plan row or a savings badge, without developer help.
- Set up conversion tracking against the event closest to revenue, for instance a completed checkout.
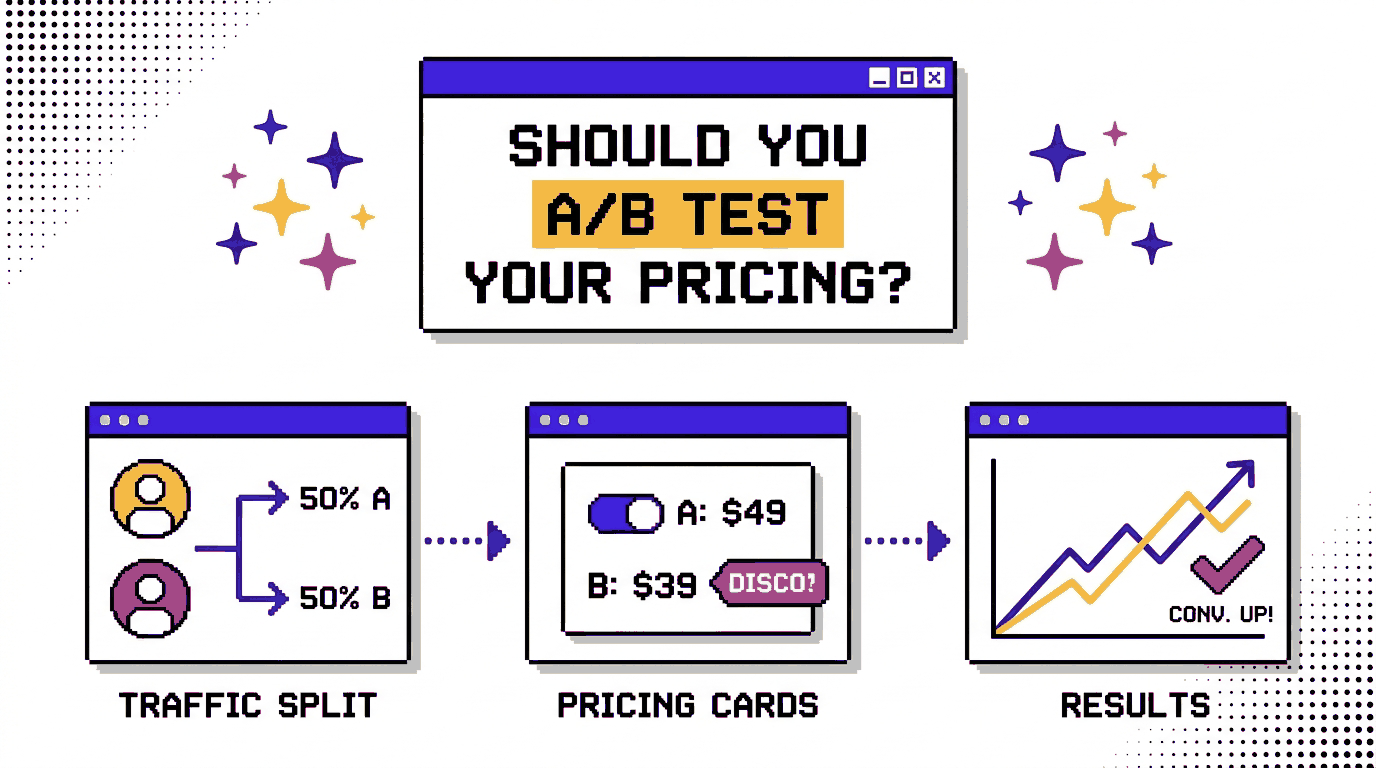
- Launch the A/B test so traffic splits between the control and the variant.
- Check analytics and heatmaps to see where visitors hesitate on the page, which tells you the next element to test.
- When two changes belong together, such as plan order and a badge, multivariate testing shows how they interact. If you’re new to the method, our guide to what an A/B test is covers the basics, and a 14-day free trial is available when you want to try it on your own pricing page.
Conclusion
Testing your pricing page is worth doing, and the test you pick depends on which question you want answered. Anchoring, plan order, billing defaults, discount wording, trial framing, price visibility and comparison tables all keep the price constant, so they carry little risk and teach you how visitors read what you already charge. Testing the amount itself calls for a plan that accounts for fairness, customer trust and the months it takes for churn to show.
Start with one presentation element, such as the billing default or the plan order, and measure revenue per visitor alongside signups. Once a few of those tests are behind you, the case for testing the price itself will be easier to judge.
Ready to test your pricing page?
FAQs
Should you A/B test your pricing?
Yes, with the distinction in mind. Presentation tests on a pricing page are low-risk and informative. Tests that charge visitors different amounts need extra safeguards and a longer measurement window.
What is the difference between pricing-page CRO and pricing strategy?
Pricing-page CRO changes how existing prices are displayed, through order, labels, toggles and tables. Pricing strategy sets the amounts, tiers and billing model themselves.
Is it legal to show different prices to different visitors?
The answer depends on the country and on how the price is chosen. Check consumer protection and pricing rules where you sell, and speak with a lawyer before running a price test. Presentation tests charge everyone the same amount, which avoids the question.
How long should a pricing page test run?
Run it until it reaches the sample size you set before launch, across full weeks so weekday and weekend behavior both appear. Pricing pages often get less traffic than other pages, so plan for weeks and read refund and churn data afterward. Our guide on when to stop an experiment early goes deeper.
Which pricing page element should you test first?
The billing default or the highlighted plan, because both shift plan mix and revenue. Mida points to structural levers such as plan count, billing default and the highlighted plan over cosmetic edits like button color (Mida).
What is the difference between price anchoring and decoy pricing?
Anchoring sets a reference number, usually with a high-priced plan shown first. Decoy pricing adds a plan whose main job is to make a neighboring plan look better value.
Should you hide your pricing?
That depends on your sales model. Test it with qualified conversations and closed revenue as the metrics, since form submissions favor hidden prices.